Monitor Product and Service Share – Market Analysis Data Visualization
RJ0400005_9
- Last Update 05/18/2025
- File Size 0.4MB
- # of Slides 2
- File Format PPTX
- Slide Ratio 16:9
- Color
Keywords
About the Product
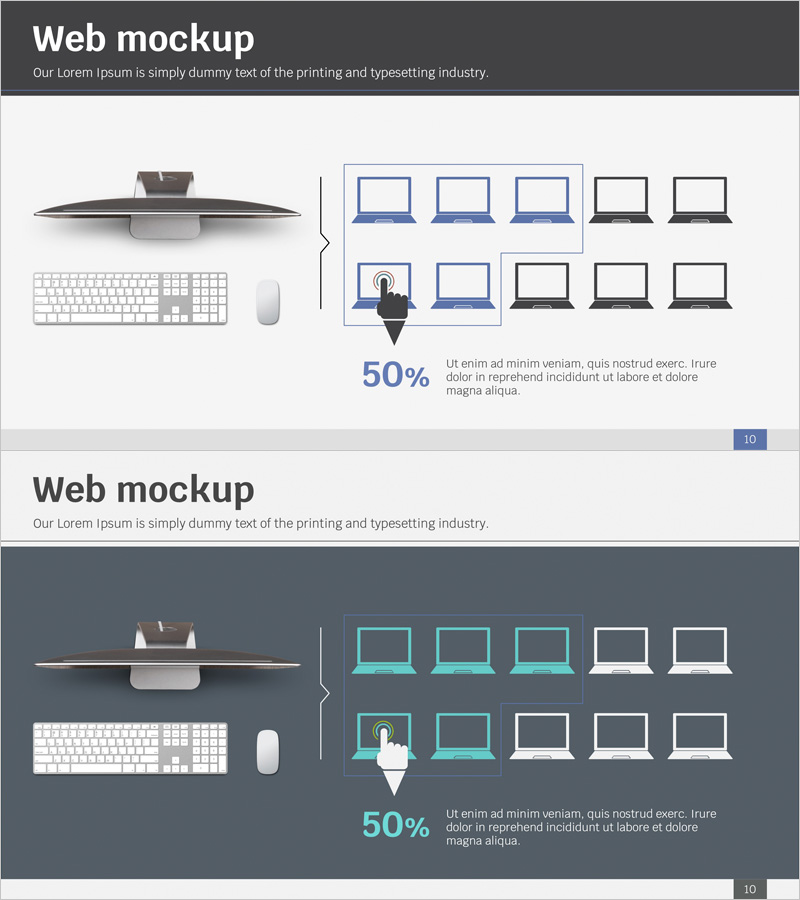
A PowerPoint slide designed to visualize market share data for monitor products and services with clear product comparison. Provided as a 2-slide set featuring a left-side layout with desktop monitor imagery and peripherals (keyboard, mouse), and a right-side grid displaying 10 product models in a 2×5 arrangement to illustrate market share distribution. Light background with blue and black accent lines creates clear information hierarchy, while a prominent 50% data highlight area conveys key market share metrics intuitively. Delivered in 16:9 widescreen PPTX format for immediate editing and customization. Ideal for market analysis presentations, competitive landscape reviews, and product positioning in investor pitches or strategic planning sessions.
Usage Points
-
Main Usage
Transforms market share data into a visual narrative by combining product imagery with quantitative metrics, making competitive positioning immediately clear. Effectively communicates market dynamics in electronics, IT, and consumer technology sectors to investors, partners, and internal stakeholders during strategic decision-making sessions.
-
How to Use
Replace left-side product image with your target product photograph. Update product model names and market share percentages in the right-side grid with actual data. Modify the 50% highlight area to feature your primary market metric or category. Use slide 1 for overall market share overview and slide 2 for category-specific breakdowns. Adjust blue and black accent lines to emphasize key competitors.
-
Recommended For
Business plans, investment pitch decks, product launch presentations, and marketing strategy documents requiring market analysis sections. Suitable for electronics, IT, telecommunications, and consumer appliance companies presenting market landscape analysis, consulting firms delivering industry research reports, and product development teams supporting go-to-market strategies.
-
Slide Structure
2-slide format with consistent layout: left section for product imagery (1 editable area), center divider line, right section with 10-product grid (model names + market share data). Bottom-right 50% highlight zone emphasizes key metrics. Blue and black accent lines organize information hierarchy across both slides for visual consistency.
Related Products
-

Lighting Graph – Market Share and Target Analysis
#Market and Competitor Analysis #Graph #Other
-

Target Market Map for the US Space Industry – Market Analysis Slide
#Market and Competitor Analysis #Graph #Other
-

Innovative AI Themed Hexagonal Graph – Visualizing Market Share at Angles
#Product/Service Introduction #Market and Competitor Analysis #Graph
-

Target Area Market Share Analysis Graph – Emphasizing Market Competition
#Market and Competitor Analysis #Graph #Other
