Slide to Effectively Present Research Analysis Results
RJ0400002_17
- Last Update 05/17/2025
- File Size 1.7MB
- # of Slides 2
- File Format PPTX
- Slide Ratio 16:9
- Color
Keywords
About the Product
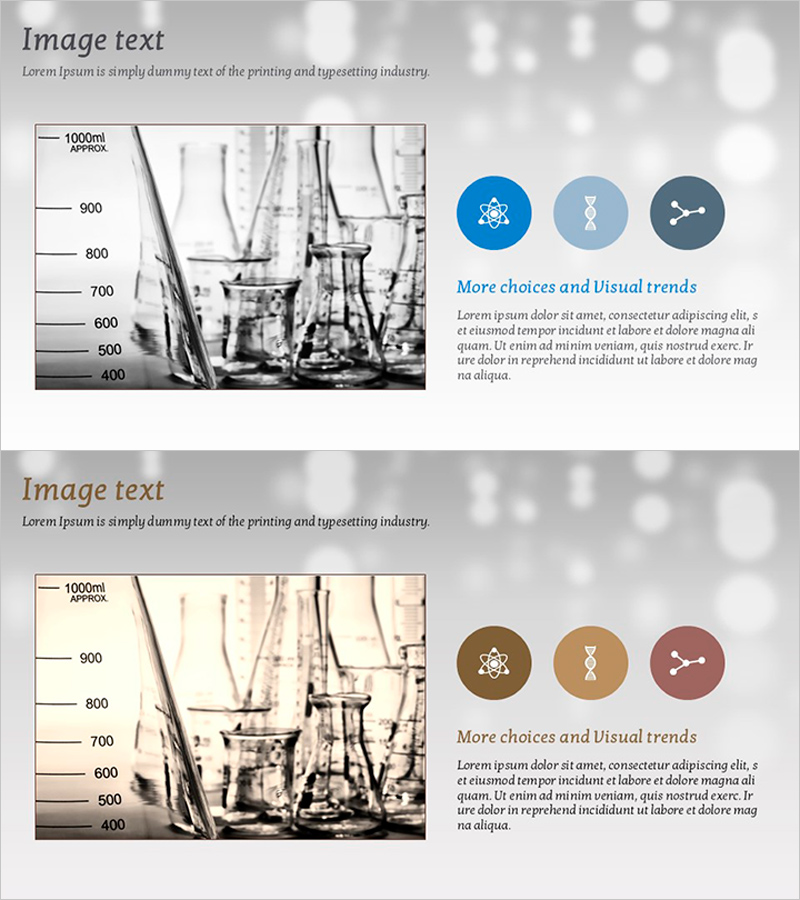
A 2-slide PowerPoint presentation template designed to effectively communicate research analysis findings. The layout features a large image area on the left side and three circular icons with descriptive text on the right, creating a balanced and professional composition. The gray-toned background with blue and brown accent icons conveys credibility and expertise. This slide template is ideal for presenting research outcomes, analytical insights, and program introductions, and can be immediately edited and customized for your specific presentation needs.
Usage Points
-
Main Usage
This slide template is designed to present research project outcomes, data analysis results, and program evaluation findings to your audience in a clear and compelling manner. By combining images and icons, you can transform complex analytical information into intuitive visual representations and emphasize key messages effectively.
-
How to Use
Insert your research-related photograph or graph in the left image area, then add your main analysis findings or program highlights in the three icon sections on the right. Edit the text beneath each icon to match your presentation content, then incorporate the customized slide into your PowerPoint presentation.
-
Recommended For
Ideal for researchers, government agencies, think tanks, and consulting firms presenting research findings, program evaluations, and analytical reports. Suitable for academic presentations, policy briefings, project completion reports, and various professional communication scenarios.
-
Slide Structure
Consists of 2 slides, each divided into a large image area on the left (approximately 40%) and a text/icon section on the right (approximately 60%). The right section features 3 circular icons with accompanying descriptive text arranged vertically, creating a clear information hierarchy.
Related Products
-

Introducing the Business Asset Management Program - Effective Utilization
#Product/Service Introduction #Composition #Program Introduction
-

Introduction to Medical Program Slide – Building Trust with Experts
#Product/Service Introduction #Diagram #Composition
-

Diagram Slide for Introducing Event Program
#Product/Service Introduction #Diagram #Composition
-

Program Introduction Diagram Slide – A Template with Visual Appeal
#Product/Service Introduction #Diagram #Composition
