Infographic Slide Visualizing Core Cosmetics Components
RJ0400002_10
- Last Update 05/17/2025
- File Size 2.3MB
- # of Slides 2
- File Format PPTX
- Slide Ratio 16:9
- Color
Keywords
- #Content-Based Slides
- #Design-Based Slides
- #Business Strategy
- #Operational Plan
- #Diagram
- #Production and Technology Development Strategy
- #Cluster
- #Closed Cluster Diagram
- #Chain Diagram
- #16:9
- #3-item connected diagram PowerPoint
- #circular node infographic slide
- #PowerPoint icon diagram template
- #product component visualization
- #business strategy PPT slide
About the Product
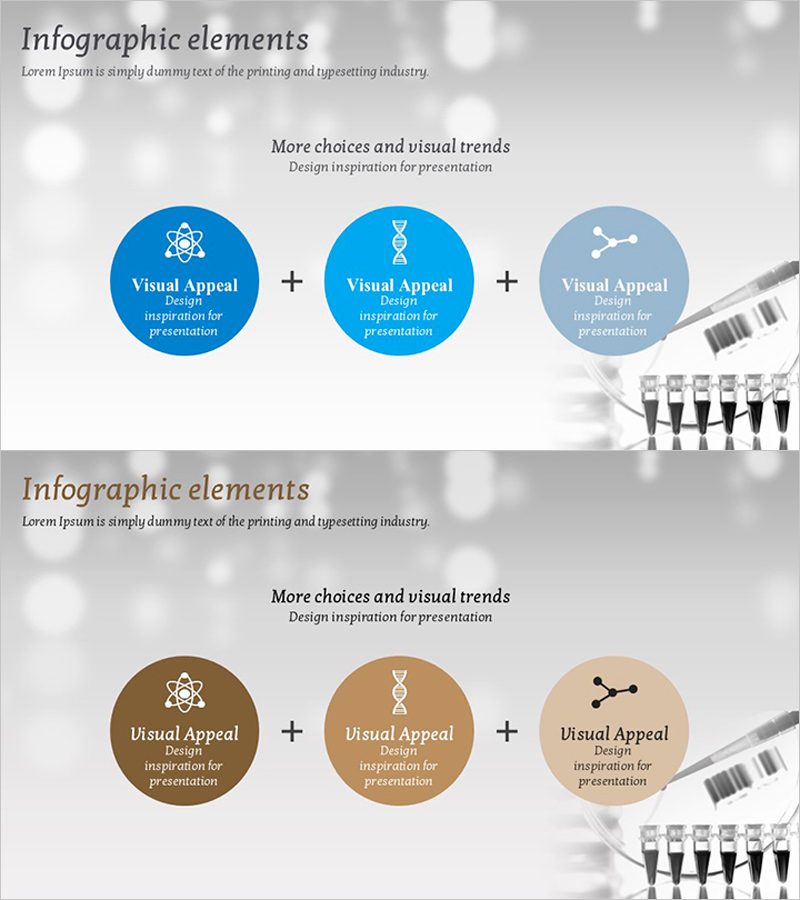
A connected infographic slide featuring three circular nodes linked with plus symbols. The design uses blue, light blue, and gray-toned circular buttons with icons and text to visualize product components, three-step services, or core business values. Optimized for 16:9 widescreen format, this 2-slide PowerPoint template is ready for immediate use in cosmetics, technology, and business strategy presentations. Each circular node is independently editable, allowing you to customize icons, colors, and text freely for your brand identity.
Usage Points
-
Main Usage
Ideal for visualizing three core product components, three-step service delivery processes, or three key business strategy pillars with equal emphasis. The plus-symbol connections clearly express relationships between elements, promoting integrated understanding.
-
How to Use
Use in cosmetics, technology, finance, and marketing presentations to introduce product lineups, service structures, or strategic frameworks. Customize each circular node's icon by industry, adjust text and background colors to match your brand identity, and adapt the layout to your presentation context.
-
Recommended For
Product managers, marketing professionals, executives preparing reports, technical presenters, and consultants who need to emphasize three equally important elements. Particularly valuable in cosmetics, beauty, IT, finance, and manufacturing sectors.
-
Slide Structure
Slide 1: Three circular nodes in blue, light blue, and gray tones, each containing an icon and text area, connected by plus symbols. Slide 2: Identical structure with brown, beige, and light tan color variants. Right side of each slide accommodates product images or background elements.
Related Products
-

Travel Icon Connection Diagram
#Business Strategy #Technical Approach #Diagram
-

Cat Characteristics Diagram – Understanding in Cluster Format
#Business Strategy #Business Management #Diagram
-

Clear Representation of Sales and Marketing Strategy with Cluster Diagram
#Business Strategy #Marketing Plan and Strategy #Diagram
-

Rotating Arrow Diagram – Business Strategy and Operations Planning
#Business Strategy #Operational Plan #Diagram
