Visualizing Financial Plans with an Income Statement Table Slide
RJ0300095_19
- Last Update 05/16/2025
- File Size 1.9MB
- # of Slides 2
- File Format PPTX
- Slide Ratio 16:9
- Color
Keywords
- #Content-Based Slides
- #Design-Based Slides
- #Financial Plans and Performance
- #Diagram
- #Income Statement
- #Key Financial Indicators
- #Table
- #16:9
- #financial table PowerPoint slide
- #income statement presentation design
- #financial data table slide
- #how to create financial tables in PowerPoint
- #financial metrics table layout
About the Product
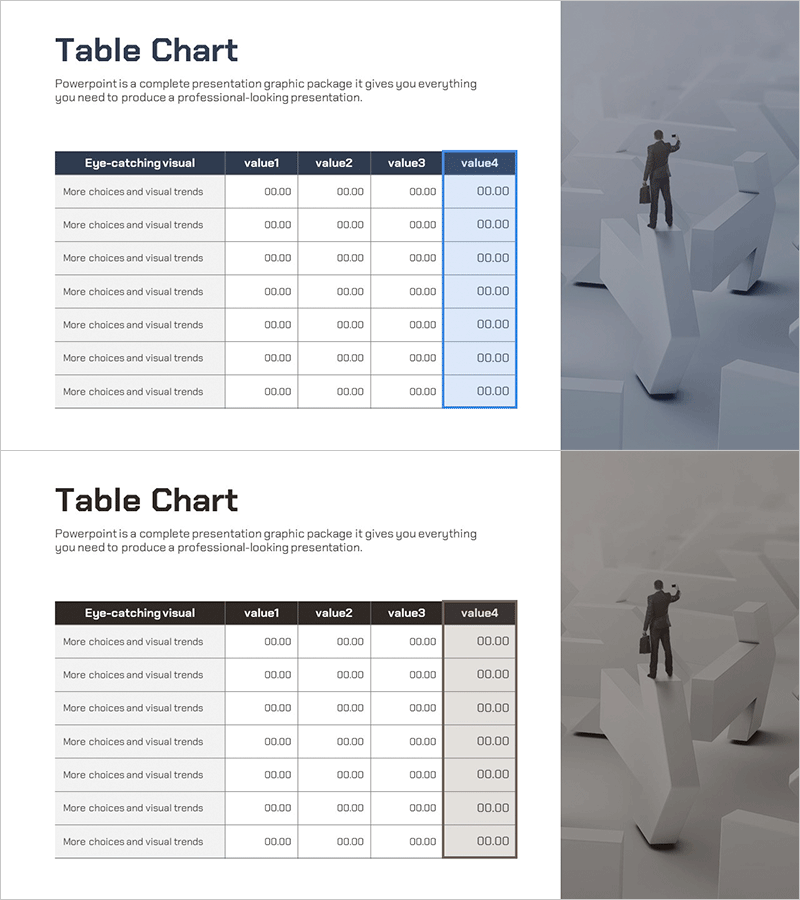
A professional PowerPoint table slide designed to visualize financial plans and income statements with clarity and impact. The dark navy header combined with light gray background creates strong visual contrast that enhances data readability and emphasizes key financial metrics. The 5-row by 4-column structure efficiently organizes financial information, and the 2-slide set is optimized for 16:9 widescreen format. Each slide is fully editable—simply input your actual financial data and the presentation is ready to use. Ideal for investor presentations, financial reports, business plans, and quarterly earnings announcements where credible financial communication is essential.
Usage Points
-
Main Usage
Present financial data and income statement information in a clear, organized table format. The dark navy header and light gray background create visual hierarchy that makes numerical data easy to scan and understand, building credibility with investors, executives, and stakeholders.
-
How to Use
Use in investor relations presentations (IR), financial reports, business plans, and quarterly earnings announcements. Enter column headers (value1–value4) in the header row, then input actual financial figures in the data rows below. The color scheme and layout are fixed, so you only need to replace the data for immediate use.
-
Recommended For
CFOs, financial managers, executives, and investor relations professionals presenting financial performance. Particularly effective for income statements, balance sheets, cash flow statements, and budget summaries. Suitable for public company IR, startup fundraising pitches, and internal management reporting.
-
Slide Structure
2-slide set, each with a 5-row by 4-column table. The first row features a dark navy header for column titles, followed by 5 data rows for financial figures. The rightmost column is highlighted with a blue border to emphasize key metrics and draw visual attention.
Related Products
-

Sea Lighthouse Key Financial Indicators Table
#Financial Plans and Performance #Diagram #Income Statement
-

Income Statement Table - Clear and Professional Data
#Financial Plans and Performance #Diagram #Income Statement
-

Fire Department Work Table – Visualizing Financial Plans and Performance
#Financial Plans and Performance #Diagram #Income Statement
-

Space Illustration Theme Chart – Income Statement and Key Financial Metrics
#Financial Plans and Performance #Diagram #Income Statement
