Comparative Analysis Graph of Future Prospects
RJ0300094_22
- Last Update 05/15/2025
- File Size 1.9MB
- # of Slides 2
- File Format PPTX
- Slide Ratio 16:9
- Color
Keywords
About the Product
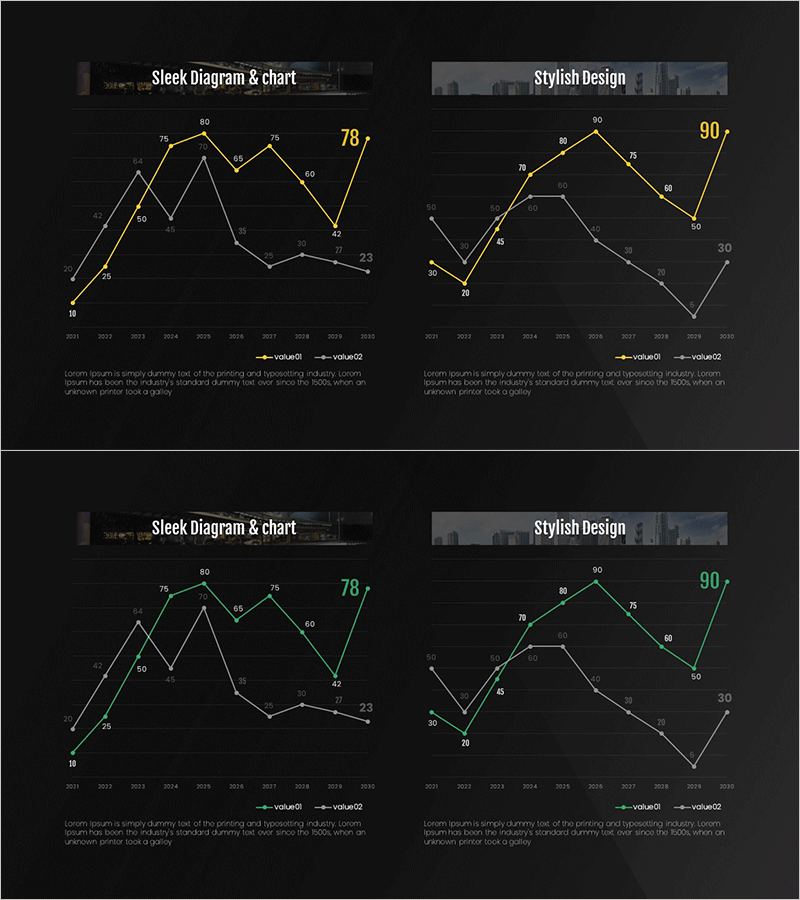
A 2-slide PowerPoint presentation template for market trend and future outlook comparative analysis. The dark background features dual line charts in gold and gray, clearly visualizing two data series trends. Each slide accommodates 10+ years of time-series data with a title section at the top and descriptive text area at the bottom. Ideal for quantitative data-driven presentations on competitive analysis, market share evolution, and industry growth rate comparisons in business plans, investor pitches, and market analysis reports.
Usage Points
-
Main Usage
Communicate market insights to executives and investors by quantitatively comparing current market conditions with future projections. The dual data series simultaneously display competitive relationships, growth rate differences, and market share shifts in an intuitive visual format.
-
How to Use
Insert into the market overview section of business plans, investor pitch decks, and market analysis reports. Label the slide title with the analysis subject (e.g., domestic vs. global market, Company A vs. Company B) and fill the bottom description area with key insights and interpretations to enhance audience comprehension.
-
Recommended For
Executives, marketing managers, business development teams, investment professionals, and consultants presenting market analysis findings. Essential for competitive benchmarking, market share trend analysis, industry growth rate comparisons, and future market projection decision-making processes.
-
Slide Structure
Each slide features a 3-part layout: top title section (slide name + analysis subject input), central chart area (dual line chart + numerical labels + legend), and bottom descriptive text area (3-4 lines of analysis). X-axis displays 10+ years of time-series data while Y-axis compares two data series numerically.
Related Products
-

Line Graph for Market Trend Analysis – Insights for Education
#Market and Competitor Analysis #Graph #Future Outlook
-

Curved Theme Purple Template Area Chart – Market Trend Analysis
#Market and Competitor Analysis #Graph #Future Outlook
-

Camping Business Trend Graph – Future and Vision
#Market and Competitor Analysis #Graph #Customer Analysis
-

Visualization of Learning Response Data – Market Trend Analysis
#Market and Competitor Analysis #Graph #Future Outlook
