Tree Structure Diagram for Visualizing Business Strategies – System Composition
RJ0400011_29
- Last Update 05/20/2025
- File Size 0.3MB
- # of Slides 2
- File Format PPTX
- Slide Ratio 16:9
- Color
Keywords
About the Product
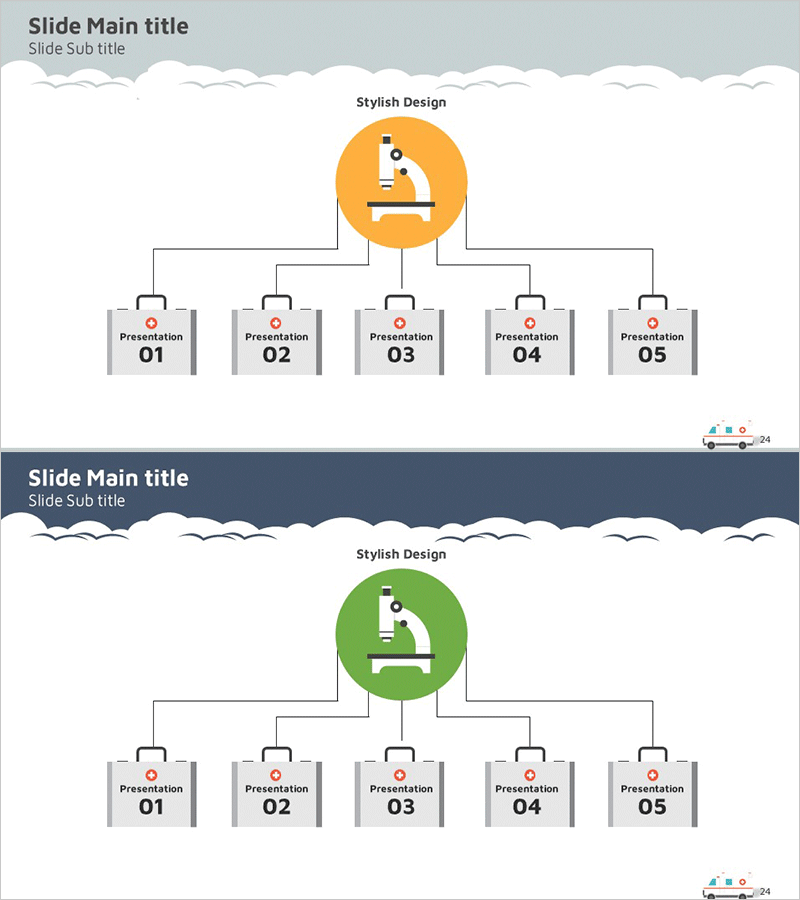
A hierarchical tree diagram PowerPoint slide featuring a central circular icon branching into five subordinate nodes. Available in two color versions—orange and green—with each node represented by a folder icon to intuitively visualize organizational structures, system architectures, and task allocation frameworks. Optimized for 16:9 widescreen format with 2 slides, ready for immediate use in technical presentations, system architecture explanations, and organizational chart creation.
Usage Points
-
Main Usage
Optimized for expressing organizational hierarchies, system architectures, and task allocation frameworks in a layered structure. The central core element branches into five subordinate items, clearly communicating dependency relationships between parent and child concepts.
-
How to Use
Use in technical presentations, IT system explanations, organizational chart creation, and project structure descriptions. Edit node text to input actual department names, system module names, or task items for immediate presentation use.
-
Recommended For
Recommended for IT technicians, system engineers, organizational managers, project managers, and technical planning teams explaining system composition, organizational structures, and business processes. Suitable for technical seminars, internal training, and executive briefings.
-
Slide Structure
Comprises 2 slides, each featuring a central circular icon (orange/green) branching into 5 subordinate nodes in a tree structure. Nodes are marked with folder icons and numbers (01–05), with straight connector lines expressing hierarchical relationships.
Related Products
-

Auto Business Ops Diagram – Efficiency and Innovation
#Technical Approach #Diagram #Service Architecture Diagram
-

Experimental Setup Diagram – Technology and Innovation
#Product/Service Introduction #Technical Approach #Diagram
-

Visualization of Trial Procedures and Configurations
#Company Introduction #Technical Approach #Diagram
-

Structured Map of Learning Topics – Organized for the Technical Sector
#Company Introduction #Technical Approach #Diagram
