Space Theme Area Graph – Market and Competitor Analysis
RJ0700013_28
- Last Update 07/25/2025
- File Size 1.1MB
- # of Slides 2
- File Format PPTX
- Slide Ratio 16:9
- Color
Keywords
About the Product
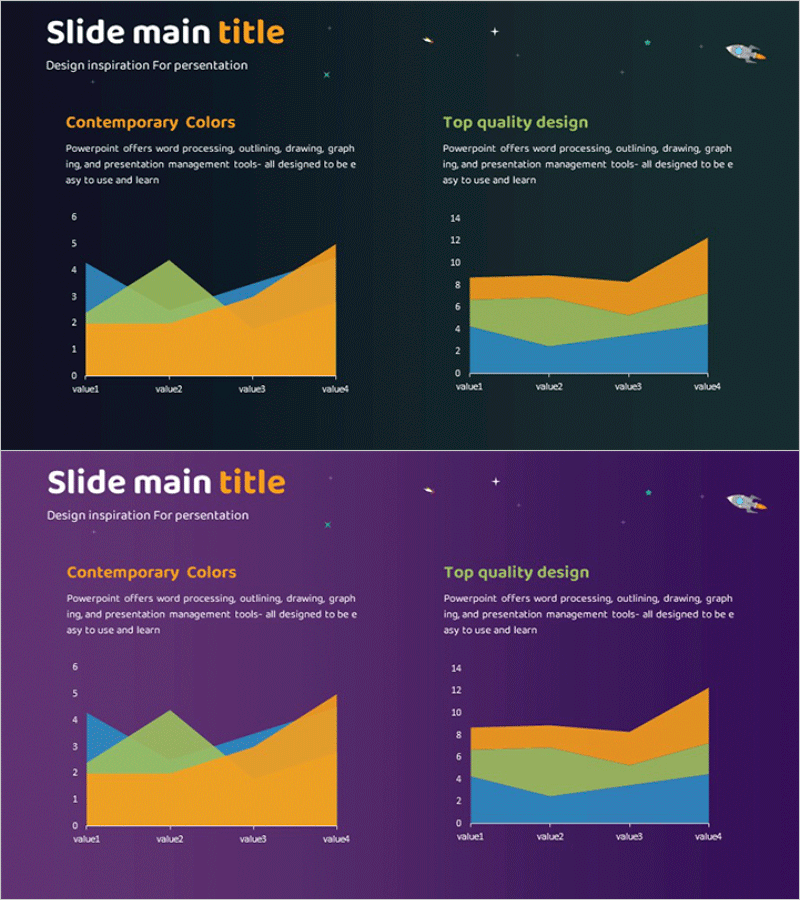
Area chart PowerPoint slide designed for market and competitor analysis presentations. Features a dark navy and purple background with orange, blue, and green layered area charts in a space-themed design, enabling simultaneous data comparison across two sections. Each area layer represents independent data dimensions, with descriptive text on the left and chart visualization on the right. Ideal for business presentations, reports, and investor pitches to convey market share, competitive positioning, and growth trends in an intuitive visual format.
Usage Points
-
Main Usage
Visualize market conditions, competitor market share, and industry trends using layered area charts to support strategic decision-making. The two-section comparison format reveals market structure shifts and competitive intensity at a glance, enhancing data credibility in investor and stakeholder presentations.
-
How to Use
Insert into the market analysis section of business plans, investor decks, or marketing strategy presentations to illustrate market size, share distribution, and competitive landscape. Enter analysis text in the left panel and update chart data with actual figures for immediate use. Colors remain consistent while legends, axis labels, and data values are fully editable.
-
Recommended For
Strategy managers, business development teams, financial analysts, and consultants presenting market research findings. Particularly effective for competitive positioning analysis, market share trends, and industry evolution discussions in C-suite and investor meetings.
-
Slide Structure
Each slide combines a left text area (title and 2-3 descriptive lines) with a right-side area chart (3-4 data layers). The chart includes four X-axis intervals and numerical Y-axis scale, with distinct color stratification enabling clear data comparison and trend identification.
Related Products
-

Rocket Illustration Template Cover – Area Graph for Market Analysis
#Market and Competitor Analysis #Graph #Other
-

Visualizing Bar Graphs with PC Mockups – Competitive Market Analysis Tool
#Market and Competitor Analysis #Graph #Other
-

Smart Area Analysis Graph – Market and Competitor Analysis Tool
#Market and Competitor Analysis #Graph #Other
-

Two Types of Area Graphs – Market and Competitor Analysis
#Market and Competitor Analysis #Graph #Other
