Free Donut Chart PowerPoint Template | Soft Rounded Circular Graph Diagram
OD0100011
- Last Update 12/03/2025
- File Size 0.1MB
- # of Slides 2
- File Format PPTX
- Slide Ratio 16:9
- Color
Keywords
About the Product
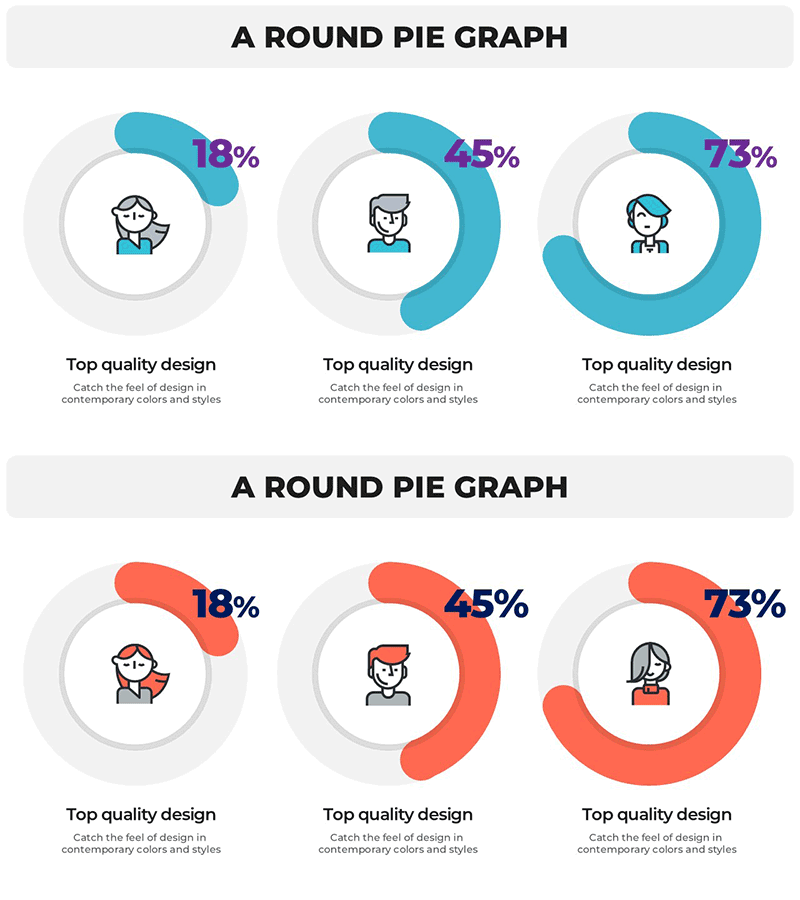
This free donut chart PowerPoint slide comes in two color versions — teal and coral — making it easy to match your presentation's visual tone. The layout features three horizontally arranged donut charts, each with a line-style person icon at the center, ideal for visualizing percentage data by customer segment, team, or audience group. Bold purple percentage labels on a white background ensure strong data readability across slides and presentation decks. The three-column structure allows clear side-by-side ratio comparisons, making it a versatile addition to market analysis, survey results, or performance reports. Simply replace the percentage values, titles, and descriptions with your own data to complete the slide. All elements are fully editable in PowerPoint. For more donut chart and graph slide options, explore the full collection at GoodPello.
Usage Points
-
Main Usage
Designed to visualize percentage-based data across three categories — such as market share, customer segments, or survey results — using a clean donut chart layout with person icons at the center of each chart.
-
How to Use
Choose either the teal or coral color version to match your presentation style, then replace the percentage values, chart titles, and description text with your actual data. All elements are editable directly in PowerPoint.
-
Recommended For
Ideal for marketers, business analysts, consultants, and project managers who need to present ratio or percentage data clearly. Well-suited for market research reports, customer analysis decks, and performance review presentations.
-
Slide Structure
Single-slide layout with 3 donut charts arranged horizontally. Each chart includes a centered person line icon and a bottom text area for title and description. Available in teal and coral color versions.
Related Products
-

Rounded Hexagon Diagram Slides for Business
#Free Diagrams
-

Free Service Configuration Diagram Gear Diagram – Effectively Visualizing Business Flow
#Free Diagrams
-

Project Step Guide Slide – Implementing Business Strategy
#Free Diagrams
-

Free Diffusion Diagram PPT Template | Centerless Structure Presentation Diagram
#Free Diagrams
