Quality Assurance Plan Diagram – Step-by-Step Flow for Business Execution
RM0200001_26
- Last Update 10/05/2025
- File Size 3.4MB
- # of Slides 2
- File Format PPTX
- Slide Ratio 16:9
- Color
Keywords
About the Product
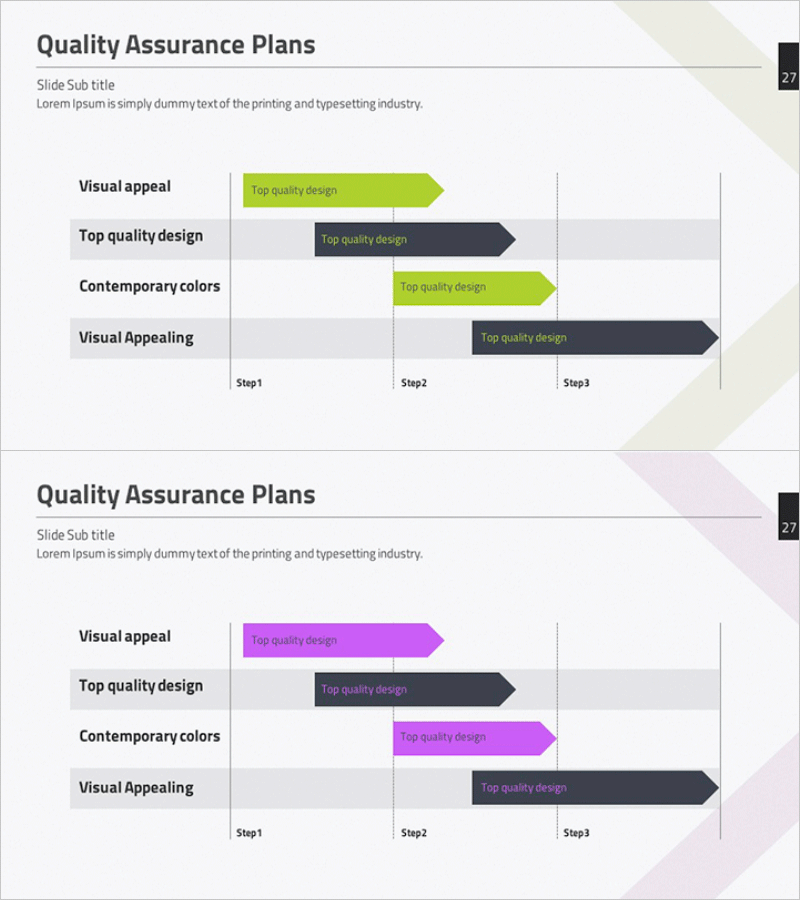
This free PowerPoint diagram slide visualizes a Quality Assurance Plan using a Gantt-style arrow bar chart layout. Two color themes are included — lime green with dark charcoal and magenta pink with dark charcoal — so you can match your brand palette without any extra design work. The slide features a four-row label column on the left paired with arrow-shaped bar indicators spanning Step 1 through Step 3 on the right, making it easy to show the scope and timing of each quality checkpoint at a glance. Alternating white and light gray row backgrounds keep each item visually distinct, while the title, subtitle, and description text areas at the top provide space for context. With 14 editable text fields in total, you can adapt this slide for quality management plans, project schedules, or phased execution roadmaps in business plans, proposals, or progress reports. For a wider range of schedule and diagram slides, explore GoodPello's premium slide collections.
Usage Points
-
Main Usage
Designed to present quality assurance plans, project timelines, and phased execution schedules by mapping four items across a three-step timeline using arrow bar indicators for clear visual communication.
-
How to Use
Replace the four row labels, arrow bar text, and the title, subtitle, and description fields at the top with your own content. Choose between the lime green or magenta pink color theme to match your brand, then insert the slide directly into your presentation.
-
Recommended For
Ideal for project managers presenting quality control plans, business planners who need a schedule slide in a proposal or business plan, and consultants visualizing phased action plans for clients or stakeholders.
-
Slide Structure
Single-slide layout with a Gantt-style arrow bar chart containing 4 rows and a 3-step horizontal timeline. Includes 3 top text areas (title, subtitle, description), 4 row label fields, 4 in-bar text fields, and 3 step labels — 14 editable text fields in total.


