Introduction Effect Detail Analysis Diagram - Core of Business Strategy
RM0700004_21
- Last Update 02/26/2025
- File Size 0.4MB
- # of Slides 2
- File Format PPTX
- Slide Ratio 16:9
- Color
Keywords
- #Content-Based Slides
- #Design-Based Slides
- #Company Introduction
- #Business Introduction
- #Business Vision and Strategy
- #Diagram
- #Company Overview
- #Business Overview
- #Cluster
- #Closed Cluster Diagram
- #16:9
- #closed cluster diagram PowerPoint
- #introduction effect analysis slide
- #4-stage performance visualization
- #business strategy diagram template
- #how to create cluster diagram in PowerPoint
About the Product
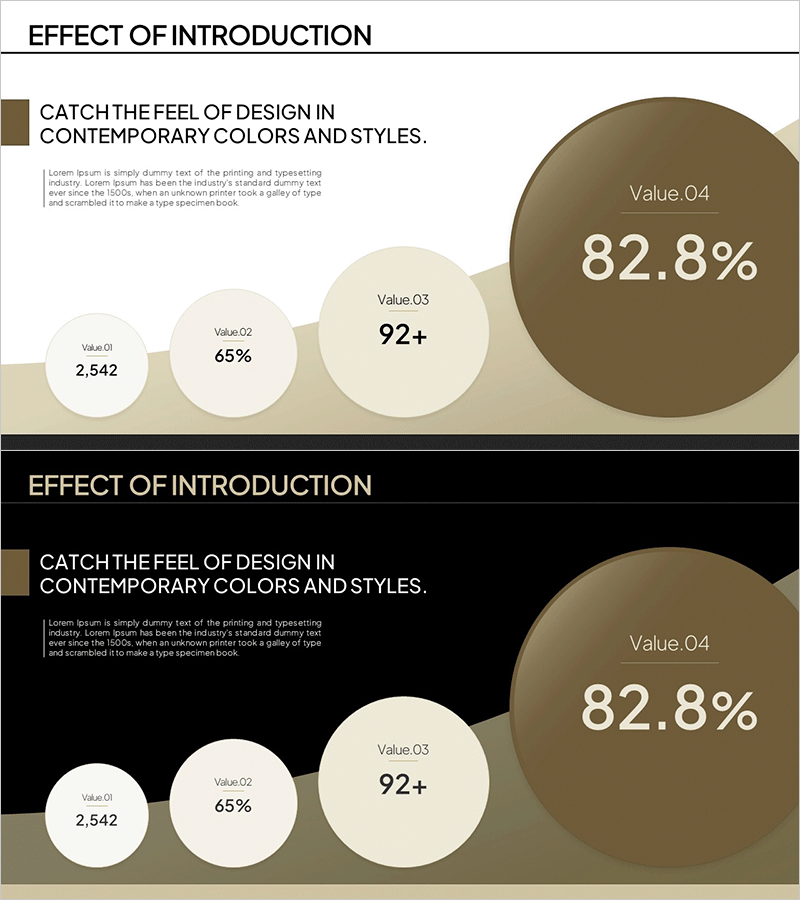
A closed cluster diagram PowerPoint slide for analyzing introduction effects across four progressive stages. The design features beige and brown background tones with white and brown circular nodes that expand incrementally, visualizing the growth trajectory from initial value (2,542) to final impact (82.8%). Each node accommodates quantitative data, effectively communicating core business strategy outcomes. The 2-slide set includes both light and dark background versions, adapting to various presentation environments. Delivered in 16:9 widescreen PPTX format for immediate editing and deployment.
Usage Points
-
Main Usage
Communicates quantitative outcomes of system, service, or policy implementation across sequential stages. The closed-node structure clearly visualizes the progression from initial investment to final impact, delivering compelling evidence of adoption value to executives, investors, and stakeholders.
-
How to Use
Input numerical values, percentages, or metric labels into each circular node to represent pre-post comparisons, cumulative stage performance, or goal achievement rates. Use the light background version for daytime presentations and print materials; deploy the dark background version for evening events and projector-based environments. Customize node colors and sizes to emphasize key metrics.
-
Recommended For
Executive reports, investment pitch decks, business performance presentations, new initiative proposals, consulting deliverables, and strategic planning documents requiring introduction effect or performance growth visualization. Particularly effective for C-suite executives, finance teams, and strategy planning departments presenting quantified outcomes.
-
Slide Structure
2-slide set presenting identical diagrams in light (beige/brown) and dark background versions. Each slide contains 4 closed circular nodes (Value.01 through Value.04) with progressively expanding sizes to intuitively represent performance growth. Text input areas and numerical display zones are clearly delineated for easy customization.
Related Products
-

Company Overview Summary Diagram - Intuitive and Sleek Design
#Company Introduction #Business Introduction #Business Vision and Strategy
-

Overview of Key Business Services – Dynamism and Innovation
#Company Introduction #Business Introduction #Business Vision and Strategy
-

Company Overview and Growth Potential Analysis – Utilizing Diagrams and Graphs
#Company Introduction #Business Introduction #Business Vision and Strategy
-

Emphasized Quote with Icon Highlights
#Company Introduction #Business Introduction #Business Vision and Strategy
