Competitor Comparison Broken Line Highlight Graph
RJ0300081_13
- Last Update 05/11/2025
- File Size 0.2MB
- # of Slides 2
- File Format PPTX
- Slide Ratio 16:9
- Color
Keywords
About the Product
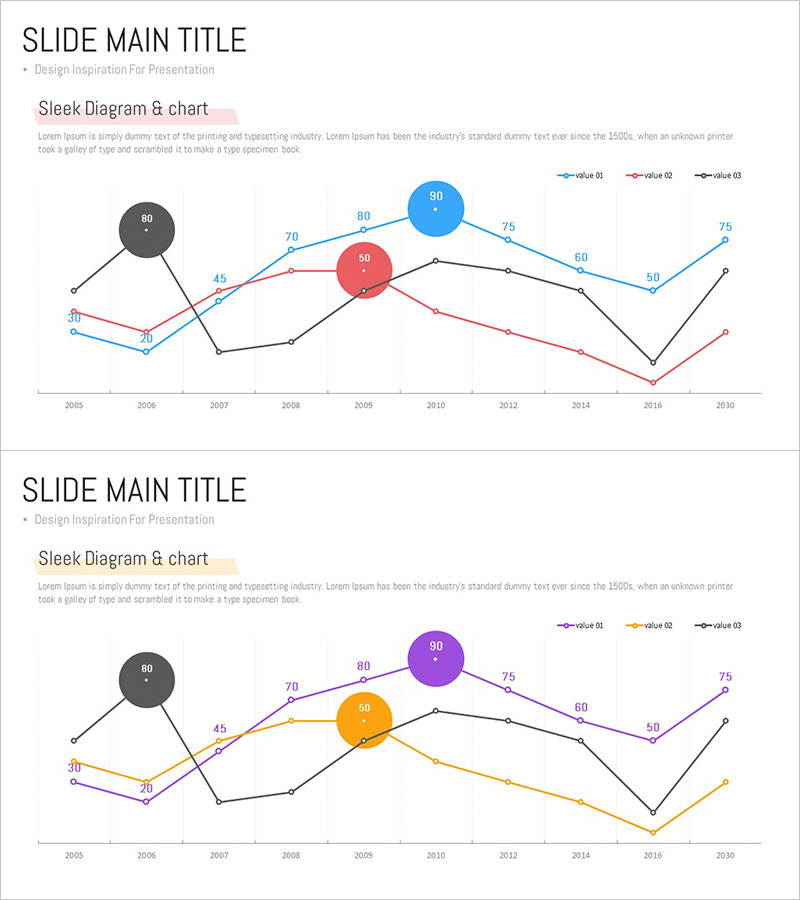
A multi-series line chart PowerPoint slide designed for competitor performance comparison analysis. This template visualizes data trends from 2005 to 2030 using three distinct color-coded series (blue, red, and black) to represent each competitor's metrics simultaneously. Central circular nodes highlight key data points, while connecting lines clearly show trend changes over time. Provided in 16:9 PPTX format with fully editable elements, this slide is ready for marketing reports, sales presentations, and executive briefings.
Usage Points
-
Main Usage
Compare competitor performance across time periods and identify market positioning trends at a glance. The three-series line structure enables simultaneous visualization of multiple competitors' key metrics, making comparative analysis clear and actionable for strategic decision-making.
-
How to Use
Replace the sample data points and series labels with your actual competitor data. Modify the circular node colors and values, update the legend labels, and adjust the timeline to match your analysis period. All elements are fully editable in PowerPoint for quick customization.
-
Recommended For
Marketing professionals preparing market analysis reports, sales teams presenting competitive landscape overviews, executives in strategy meetings, and investor presentations. Ideal for situations requiring objective comparison of multiple competitors' performance metrics over extended periods.
-
Slide Structure
Two-slide template featuring a 2005–2030 timeline with three color-coded line series. Prominent circular nodes (blue and red) emphasize critical data points, while legend and numerical labels ensure clarity. The color scheme is optimized for both digital display and print output.
Related Products
-

Variation Graph for the Line Chart – Optimized Design for Market and Competitor Analysis
#Market and Competitor Analysis #Graph #Competitor Analysis
-

Modern Theme Competitor Analysis Graph
#Market and Competitor Analysis #Graph #Competitor Analysis
-

Broken Line Comparison Graph – Optimized for Market and Competitor Analysis
#Market and Competitor Analysis #Graph #Competitor Analysis
-

Competitor Idea Analysis Graph
#Market and Competitor Analysis #Graph #Competitor Analysis
