Modern Diagram and Chart Utilization – Design Inspiration
RJ0300080_24
- Last Update 05/11/2025
- File Size 0.2MB
- # of Slides 2
- File Format PPTX
- Slide Ratio 16:9
- Color
Keywords
- #Content-Based Slides
- #Design-Based Slides
- #Product/Service Introduction
- #Operational Plan
- #Diagram
- #Development Status
- #Business Processes
- #Flow
- #Linear Flow
- #16:9
- #circular diagram PowerPoint
- #4-step cycle diagram slide
- #ratio chart PowerPoint template
- #diagram slide design
- #process visualization PowerPoint
About the Product
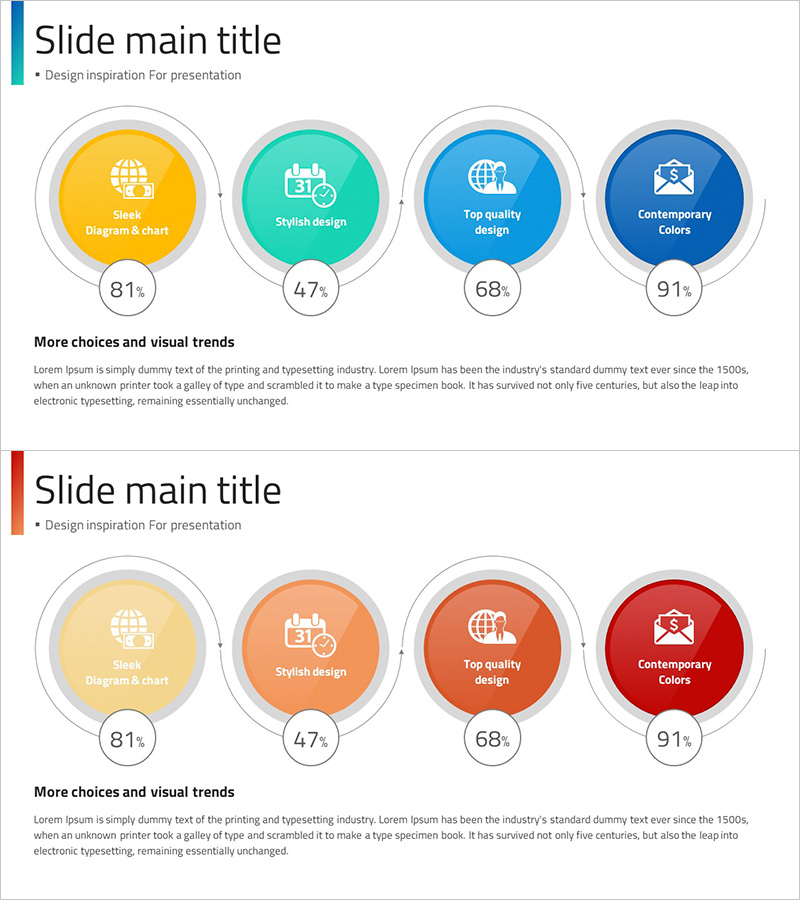
A circular diagram PowerPoint slide featuring four interconnected nodes in yellow, mint, blue, and navy colors. Each node displays percentage data at the bottom, making it ideal for presenting proportional information and comparative analysis. This presentation template works well for business reports, performance metrics, and process visualization. The 2-slide set includes color variations in blue and red tones, allowing quick customization to match your corporate branding guidelines.
Usage Points
-
Main Usage
Visually represents four key elements, their proportions, composition, and sequential relationships. Ideal for marketing performance reports, customer satisfaction surveys, product feature comparisons, and business portfolio presentations where quantitative data needs clear visual communication.
-
How to Use
Enter titles and descriptions in each circular node, then update the percentage values with your actual data. Colors can be adjusted to match your brand guidelines, and icons can be added to enhance the meaning of each section.
-
Recommended For
Marketing teams presenting campaign results, sales teams analyzing customer segments, executives presenting business portfolios, educators explaining concepts in seminars. Suitable for any presentation requiring quantitative comparison and proportional visualization.
-
Slide Structure
2-slide set. Slide 1 features blue-tone nodes (yellow, mint, blue, navy) with percentage indicators below each circle. Slide 2 uses red-tone colors (beige, orange, coral, deep red) with identical layout. Each node is independently editable with connecting lines showing circular flow.
Related Products
-

Mobile Service Process – Stepwise Operation Strategy
#Business Strategy #Operational Plan #Diagram
-

Fintech System Process Slide – Innovation in Information Delivery
#Product/Service Introduction #Operational Plan #Diagram
-

Data Security Plan Linear Diagram
#Business Strategy #Operational Plan #Diagram
-

Business Processes for Service Development - Visualizing Workflow
#Company Introduction #Business Strategy #Operational Plan
