Key Customer Analysis Chart – Customer Success Case
RJ0300078_8
- Last Update 05/11/2025
- File Size 0.8MB
- # of Slides 2
- File Format PPTX
- Slide Ratio 16:9
- Color
Keywords
- #Content-Based Slides
- #Design-Based Slides
- #Market and Competitor Analysis
- #Customer Success Stories
- #Graph
- #Customer Analysis
- #Introduction of Key Customers
- #Column
- #Grouped Column
- #16:9
- #clustered bar chart PowerPoint
- #customer analysis slide template
- #customer success case presentation
- #dual-series bar graph
- #customer data visualization PowerPoint
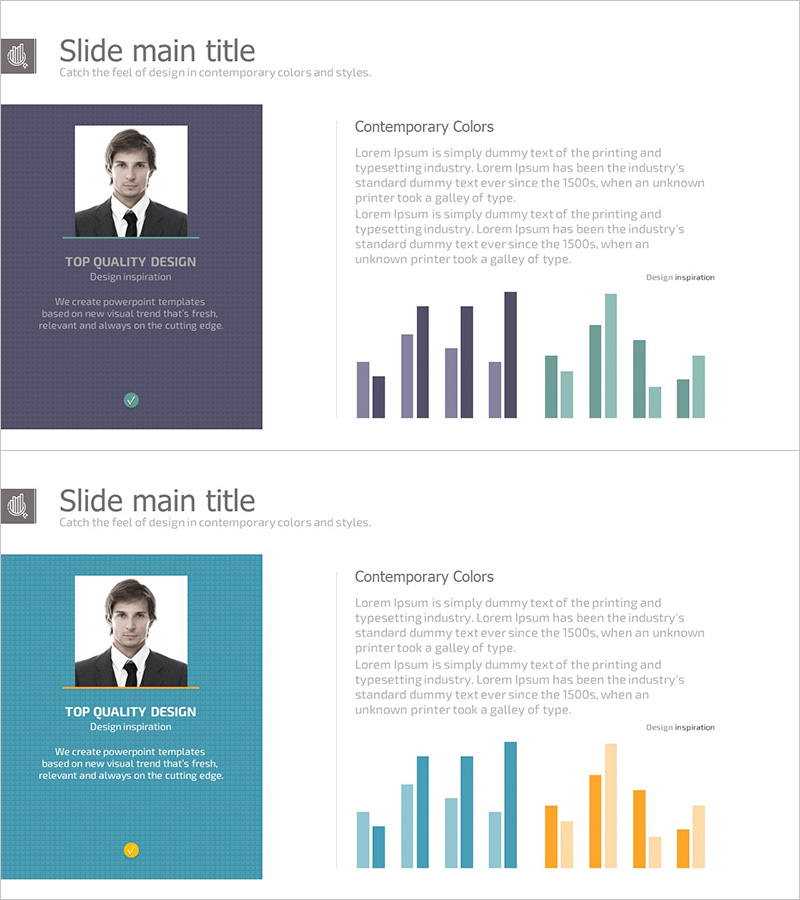
About the Product
A 2-slide PowerPoint presentation featuring clustered bar charts designed to visualize customer analysis and success stories. Each slide combines a customer profile card on the left with a dual-series bar chart on the right, using navy blue and teal backgrounds with white typography. The layout effectively presents customer information alongside performance metrics, making it ideal for customer-centric business presentations. Delivered in 16:9 PPTX format, fully editable and ready for marketing presentations, customer success case studies, and market analysis reports.
Usage Points
-
Main Usage
Present customer analysis data and success metrics side-by-side to demonstrate customer-centric business performance. The dual-series bar chart format enables clear comparison of multiple performance indicators across different customer profiles, strengthening data-driven storytelling.
-
How to Use
Enter customer name, title, and company information in the profile section on the left. Input performance metrics (revenue, satisfaction score, growth rate, etc.) into the clustered bar chart on the right. Adjust bar colors to distinguish between different customer segments or time periods for comparative analysis.
-
Recommended For
Marketing managers, sales directors, and customer success teams presenting customer analysis results and case studies to executives or clients. Ideal for market analysis reports, customer satisfaction presentations, and business performance reviews where data-backed customer insights need to be communicated effectively.
-
Slide Structure
2-slide layout with each slide featuring a customer profile card (photo, name, title, description area) on the left and a clustered bar chart (5-6 data points, navy and teal color scheme) on the right. Formatted in 16:9 aspect ratio for optimal display on widescreen presentations.
Related Products
-

User Analysis Bar Graph – Providing Customer Insights
#Market and Competitor Analysis #Graph #Customer Analysis
-

Target Settings Rounding Diagram – Customer Analysis and Success Cases
#Market and Competitor Analysis #Customer Success Stories #Diagram
-

Bundled Vertical Bar Graph Blue Green – Market and Customer Analysis
#Market and Competitor Analysis #Financial Plans and Performance #Graph
-

Challenges to Improve Korea's Image Slide – Analysis by Age
#Market and Competitor Analysis #Diagram #Graph
