Broken Line Graph for Market Competitor Analysis - Insights for Competitive Advantage
RJ0300076_23
- Last Update 05/10/2025
- File Size 0.5MB
- # of Slides 2
- File Format PPTX
- Slide Ratio 16:9
- Color
Keywords
About the Product
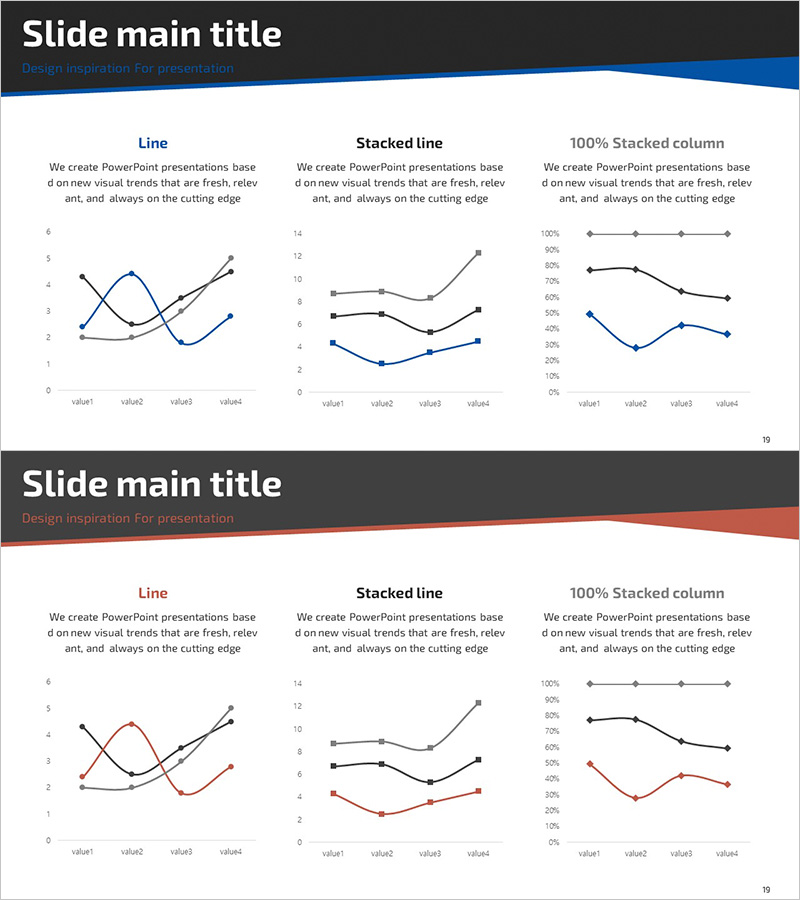
A PowerPoint slide featuring broken line graphs for market competitor analysis and competitive advantage assessment. The slide includes three data visualization types: simple line chart, stacked line chart, and 100% stacked column chart, each available in blue and red color options. Designed with four data points as the baseline, it effectively communicates competitive positioning, market share trends, and performance comparisons across competitors. The slide layout clearly separates descriptive text from chart areas, enabling immediate use in presentations. Each chart type visualizes numerical data intuitively, making it ideal for business intelligence and strategic decision-making presentations.
Usage Points
-
Main Usage
Visualize competitor performance trends, market share evolution, and competitive advantage metrics through data-driven comparison. The line chart intersections and trend lines provide intuitive representation of competitive relationships, clearly communicating market position and competitive strength to investors, executives, and team members.
-
How to Use
Place this slide in the market analysis section of investor presentations, business reports, and marketing strategy pitches. Input existing data into the chart, and lines and values update automatically. Select color options (blue or red) to match your document's tone. The four-point baseline is optimal for quarterly, annual, or competitor-by-competitor comparisons.
-
Recommended For
Executives, strategy teams, marketing departments, and finance teams presenting competitive analysis results. Particularly effective in investor pitch decks, business plans, quarterly performance reports, and market entry strategy presentations where competitive advantage must be demonstrated numerically.
-
Slide Structure
Two-slide layout with each slide containing: top title area (Slide main title + subtitle), center section with three chart types (Line / Stacked line / 100% Stacked column), and bottom descriptive text area. Data labels (value1–value4) below each chart enable precise numerical comparison.
Related Products
-

Business Program Analysis Area Graph – Competitive Edge
#Market and Competitor Analysis #Diagram #Graph
-

Service Analysis Line Graph – Visualization of Competitive Advantage
#Market and Competitor Analysis #Diagram #Graph
-

Third Party Comparison Pentagon Area Graph – Competitive Advantage Analysis
#Market and Competitor Analysis #Graph #Competitor Analysis
-

Doughnut Chart Presentation for Pet Store Competitor Analysis
#Market and Competitor Analysis #Graph #Competitor Analysis
