Business Area Overlay Diagram – A Blend of Visual Appeal and Functionality
RJ0300046_6
- Last Update 05/01/2025
- File Size 3.4MB
- # of Slides 2
- File Format PPTX
- Slide Ratio 16:9
- Color
Keywords
- #Content-Based Slides
- #Design-Based Slides
- #Company Introduction
- #Business Introduction
- #Diagram
- #Business Areas
- #Business Areas
- #Cluster
- #Combination Diagram
- #Chain Diagram
- #16:9
- #Venn diagram PowerPoint
- #3-circle overlap diagram
- #business area relationship slide
- #cluster diagram PowerPoint
- #intersection diagram template
About the Product
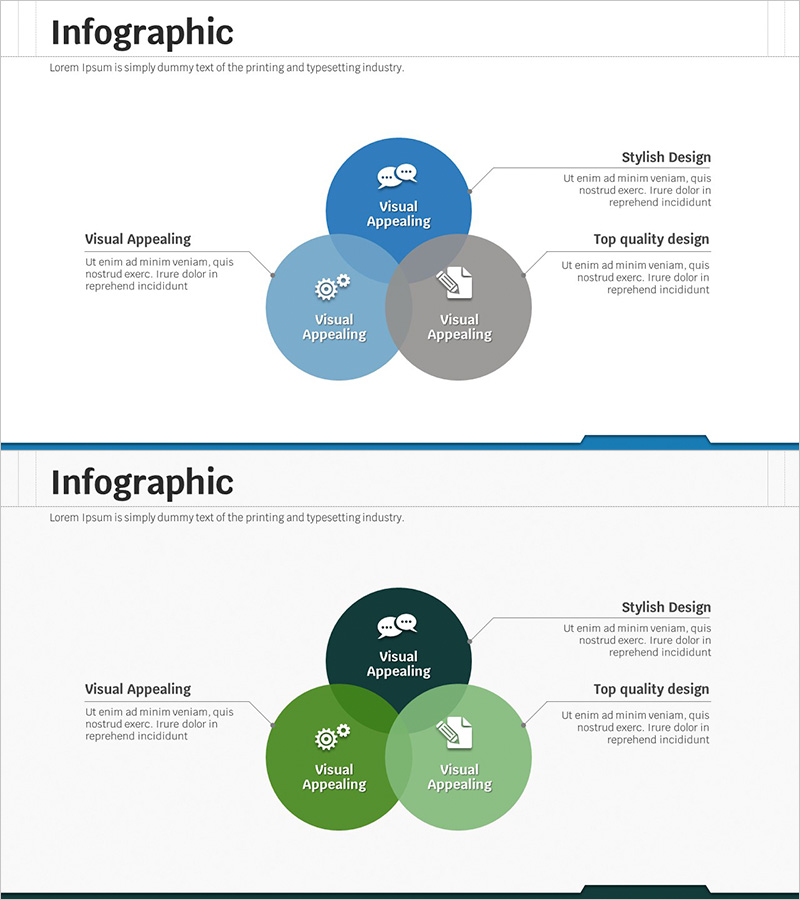
A Venn diagram-style PowerPoint slide featuring three overlapping circular nodes that emphasize intersection areas and relationships. The design uses blue, gray, and green color schemes to distinguish each area, with the central intersection ideal for placing core concepts. Text description boxes are positioned around each circle to clearly express relationships between three business elements such as strategy, visual appeal, and functionality. The 2-slide set provides both blue-tone and green-tone color versions optimized for 16:9 widescreen format. This slide effectively visualizes conceptual connections and interactions in presentations, making it ideal for explaining multi-element relationships in business contexts.
Usage Points
-
Main Usage
This slide is used to visually represent the intersection and relationships between three concepts, areas, or elements. It is particularly effective for explaining multi-element interactions during business strategy development, illustrating departmental collaboration areas in organizational structures, or highlighting shared objectives. The central intersection area can emphasize core values or unified messages.
-
How to Use
Enter department names, functions, or strategic elements in each circular node, and place integrated concepts in the intersection area. Provide detailed descriptions in the text boxes surrounding each area to enhance audience comprehension. Select the appropriate color version to match your presentation's tone, and add icons or numerical data as needed to adjust information density.
-
Recommended For
Executives, strategy managers, marketing planners, and organizational development professionals benefit from this slide when explaining organizational structures, business domains, and strategic element relationships. It is applicable to company profiles, business plans, strategy presentations, organizational restructuring announcements, and partner relationship diagrams.
-
Slide Structure
Three circular nodes overlap at the center in a Venn diagram configuration. Each circle represents an independent area, while the intersection emphasizes common elements. Text description boxes are positioned on the left, right, and top to accommodate explanations for each area. The 2-slide set applies blue-tone and green-tone color schemes to the identical structure, enabling adaptation to various presentation contexts.
Related Products
-

Question Mark Shape Diagram – Visualizing Business Areas and Connections
#Company Introduction #Business Introduction #Diagram
-

Core Business Area Diagram – Segmentation and Expansion
#Company Introduction #Business Introduction #Diagram
-

Business Area Circular Nesting Diagram – Cluster Visualization
#Company Introduction #Business Introduction #Diagram
-

Diffusion Diagram with Center for Business Area Presentation
#Company Introduction #Business Introduction #Diagram
