Top Sales Analysis Area Graph – Strategies to Win in the Market and Competition
RJ0300074_26
- Last Update 05/09/2025
- File Size 0.1MB
- # of Slides 2
- File Format PPTX
- Slide Ratio 16:9
- Color
Keywords
About the Product
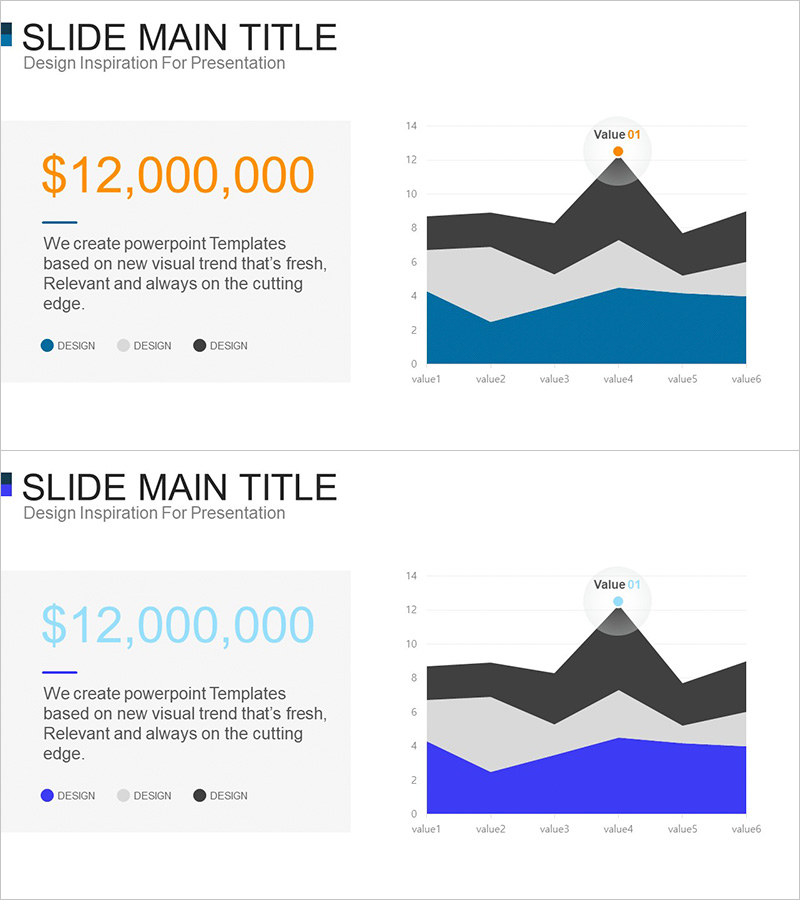
A professional PowerPoint slide featuring a 3-layer stacked area chart designed to visualize market competition and sales trends at a glance. The left section displays key metrics ($12,000,000) and descriptive text, while the right side showcases a stacked area graph with six data points tracking changes over time. The blue, gray, and charcoal color palette conveys financial credibility and analytical depth, making it ideal for presenting competitive strategy insights and revenue performance. The 16:9 widescreen format includes 2 fully editable slides ready for immediate use in presentations.
Usage Points
-
Main Usage
Effectively communicate quarterly or annual sales trends and market share changes relative to competitors to executives and investors, providing data-driven insights into competitive positioning and market performance.
-
How to Use
Input key metrics and analysis findings in the left text area, then connect actual data to the stacked area chart on the right. Use the color-coded layers to simultaneously compare multiple data series and visualize market dynamics and competitive strategies.
-
Recommended For
Executive reports, investor presentations (IR), strategic planning meetings, market analysis briefings, and quarterly performance reviews. Ideal for C-suite executives, marketing teams, and strategy departments who need to present sales performance and competitive landscape data.
-
Slide Structure
The slide layout divides into a left information panel (title, metric display, and three-line text description) and a right chart area featuring a 3-layer stacked area graph with six X-axis data points and three legend entries. Two color variations (blue and light blue tones) are provided for design flexibility.
Related Products
-

Visualizing Bar Graphs with PC Mockups – Competitive Market Analysis Tool
#Market and Competitor Analysis #Graph #Other
-

Bank Securities Service Area Graph – Market Analysis and Competitive Advantage
#Market and Competitor Analysis #Graph #Other
-

3D Area Charts and Descriptions – Suitable for Market and Competitor Analysis
#Market and Competitor Analysis #Graph #Other
-

Dividend Analysis Graph for the Last 6 Years – Financial Performance Insights
#Market and Competitor Analysis #Financial Plans and Performance #Graph
