Card Payment Service Overview and Analysis Graph
RJ0300074_14
- Last Update 05/09/2025
- File Size 0.1MB
- # of Slides 2
- File Format PPTX
- Slide Ratio 16:9
- Color
Keywords
- #Content-Based Slides
- #Design-Based Slides
- #Company Introduction
- #Market and Competitor Analysis
- #Graph
- #Other
- #Company Overview
- #Future Outlook
- #16:9
- #data analysis bar chart PowerPoint
- #market comparison slide
- #13-item data visualization
- #competitive analysis chart
- #how to create comparison charts in PowerPoint
About the Product
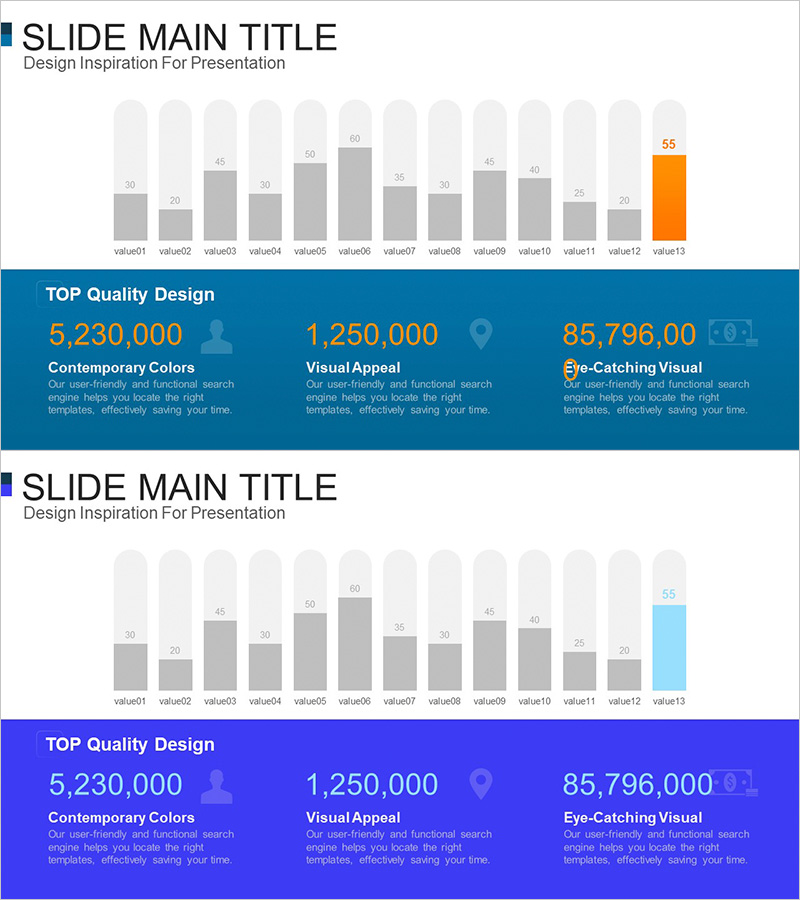
A data visualization PowerPoint slide designed for card payment service market analysis and competitive benchmarking. This presentation slide features a 13-item bar chart layout with a dark blue header section and three key metric boxes at the bottom, each containing an icon, numerical value, and descriptive text. The white background and high-contrast design maximize data readability, while the orange highlight bar draws attention to peak values. Ideal for market analysis presentations, competitive positioning reports, financial performance reviews, and strategic planning decks that require multi-point data comparison.
Usage Points
-
Main Usage
Visualize multiple data points across 13 categories using a bar chart format for clear comparative analysis. The slide structure separates information hierarchy with a title section, central chart, and three key metric boxes below, enabling audiences to quickly grasp market trends, competitive positioning, and financial performance data.
-
How to Use
Insert this slide into business plans, investor pitch decks, market analysis reports, or quarterly performance presentations. Replace the bar values and numerical data with your own metrics; the chart automatically updates. Customize the three bottom metric boxes by editing icons, numbers, and descriptive text to highlight key insights. Adjust the dark blue header and orange accent colors to match your brand guidelines.
-
Recommended For
Executives, finance teams, marketing strategists, and business development professionals presenting market analysis, competitive benchmarking, financial results, or strategic initiatives. Particularly effective when presenting multiple data points that require side-by-side comparison to support data-driven decision-making.
-
Slide Structure
Title section (main title + subtitle) + central 13-item bar chart with value labels + bottom three metric boxes (each with icon, numerical value, and descriptive text). Total of 27 editable elements including 2 title fields, 13 chart labels, and 12 metric box fields (3 icons, 3 values, 3 descriptions).
Related Products
-

Market Trends & Future Outlook Graph – An Intuitive Presentation Template
#Market and Competitor Analysis #Graph #Other
-

Visualizing the Changing Trend of the Ageing Population with a 100% Stacked Bar Graph
#Business Strategy #Market and Competitor Analysis #Marketing Plan and Strategy
-

Analysis of Business Progress by Field – Effective Business Enhancement
#Company Introduction #Graph #Other
-

Brown Green Area Chart – Data Trend Analysis
#Market and Competitor Analysis #Graph #Other
