Strategy and Expected Effects Diagram – Infographic Visualizing Business Action Strategy
RM0800010_8
- Last Update 03/01/2025
- File Size 0.4MB
- # of Slides 2
- File Format PPTX
- Slide Ratio 16:9
- Color
Keywords
- #Content-Based Slides
- #Design-Based Slides
- #Business Vision and Strategy
- #Business Strategy
- #Diagram
- #Core Competencies
- #Financial Outlook & Expected Impact
- #Spread
- #Decentralized Diagram
- #16:9
- #4-direction radial diagram PowerPoint
- #radial diagram slide template
- #strategy visualization slide
- #business strategy infographic
- #expected effects diagram
- #center-point diagram PowerPoint download
About the Product
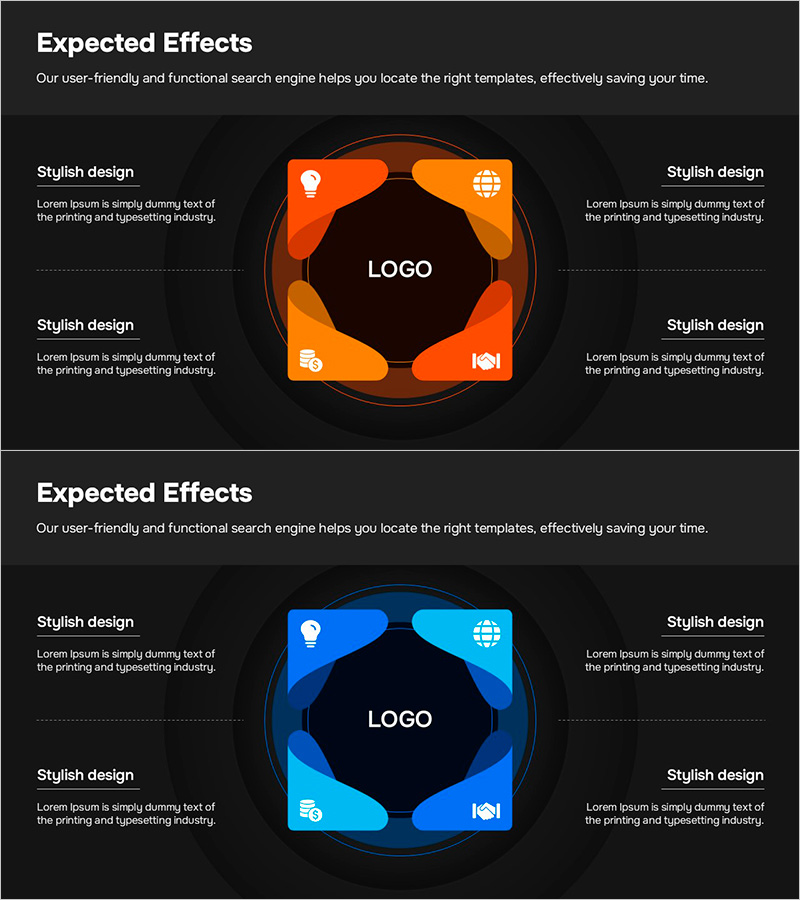
A PowerPoint slide featuring a radial diagram that extends business strategy and expected effects in four directions from a central logo. Each quadrant contains an icon and text input area, creating an infographic-style layout. Two color versions are provided: orange for dynamic energy and blue for corporate trust. The dark background contrasts with bright color blocks to deliver visual impact in presentations. This 2-slide set is ideal for visualizing strategic initiatives, marketing plans, organizational structures, and core values in business presentations.
Usage Points
-
Main Usage
Extends a central concept outward in four directions to represent strategy, effects, objectives, and implementation plans. Ideal for business strategy presentations, marketing plan briefings, organizational structure explanations, and core value communications where information needs to be organized hierarchically and visualized clearly.
-
How to Use
Enter your company name or core topic in the central logo area. Fill the four surrounding blocks with strategy elements, expected outcomes, action plans, and performance metrics using text and icons. The orange version conveys energy and action, while the blue version projects corporate credibility and stability.
-
Recommended For
Executive and strategy team business plan presentations, marketing team campaign strategy briefings, HR team organizational restructuring announcements, sales team new business proposals, consulting firm strategy reports, and startup investor pitch decks.
-
Slide Structure
2-slide set. Each slide features a central circular logo area surrounded by four curved blocks positioned at top, right, bottom, and left. Each block contains an icon (lightbulb, globe, people, handshake) and text input area. The dark background creates strong contrast with bright orange or blue blocks, emphasizing visual hierarchy and information flow.
Related Products
-

KSF Critical Success Factors Circular Diagram
#Product/Service Introduction #Business Vision and Strategy #Diagram
-

Core Technology Detail Plan Diagram – Strengthening Business Strategies through Clusters
#Business Vision and Strategy #Marketing Plan and Strategy #Diagram
-

Diffusion Strategy in Origami Design – Business Vision and Effective Connection
#Business Vision and Strategy #Diagram #Business Strategy
-

Pentagonal Diffusion Diagram for Business Strategy Visualization – Emphasizing Core Competencies
#Business Introduction #Business Vision and Strategy #Diagram
