Wave Environmental Business Report PPT Template – Stylish Green Design
M0800013
- Last Update 07/31/2025
- File Size 165.7MB
- # of Slides 20
- File Format PPTX
- Slide Ratio 16:9
- Color
Slide Preview


Keywords
About the Product
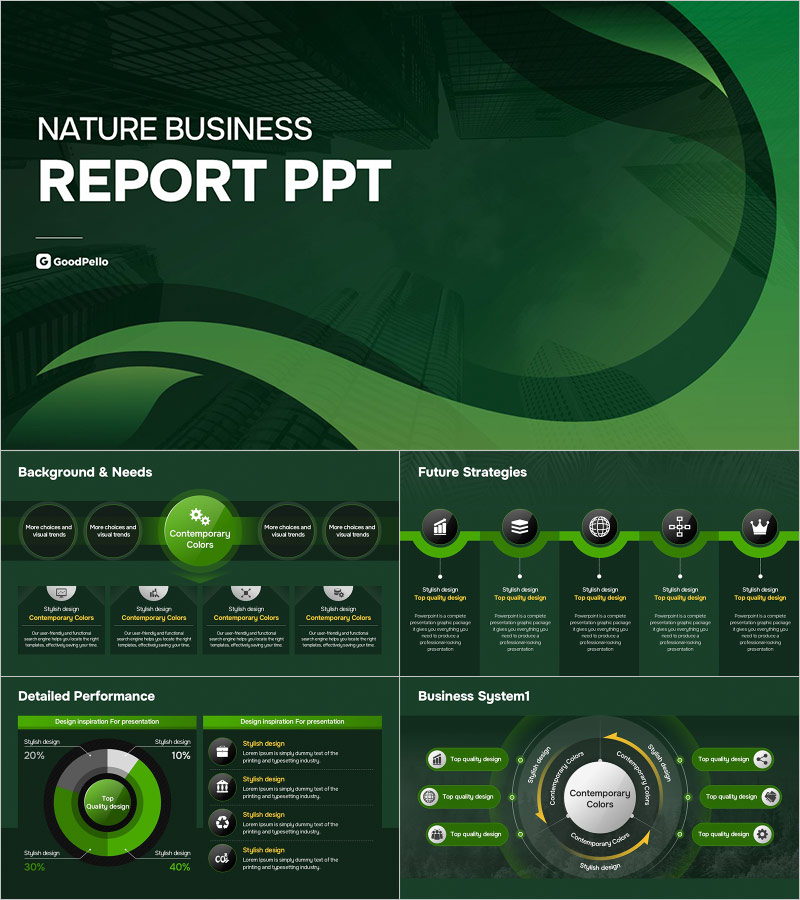
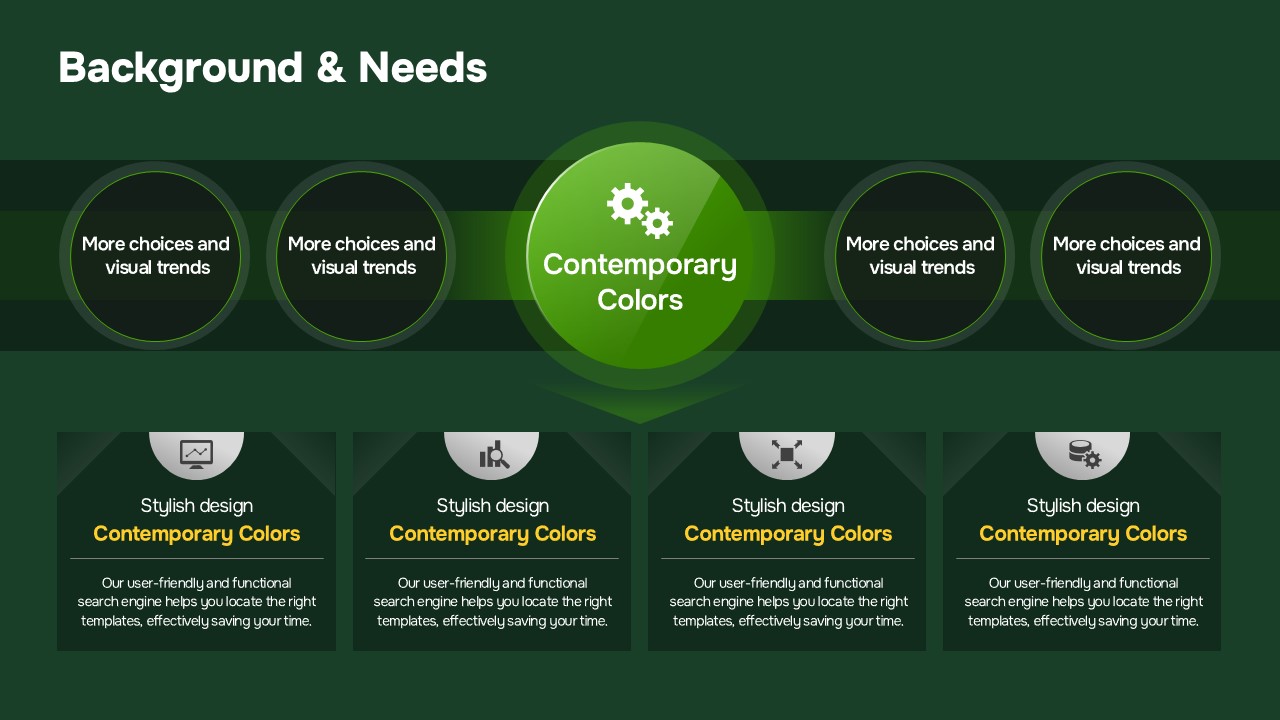
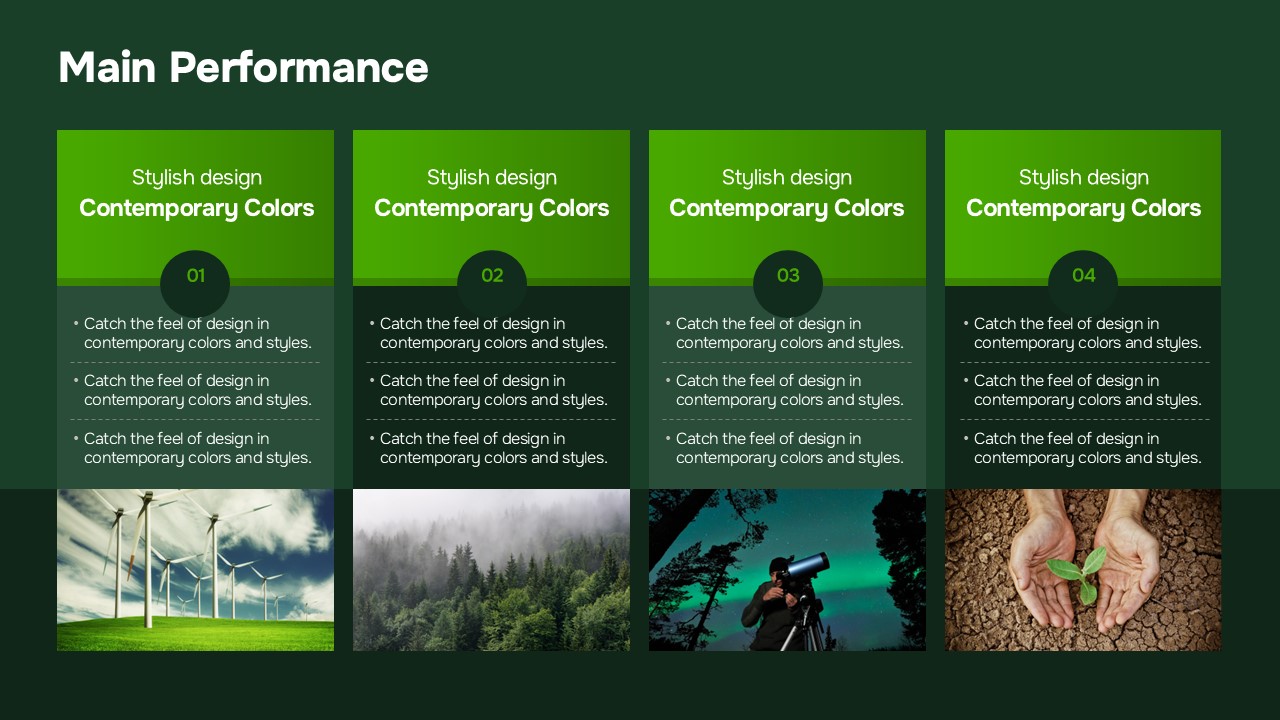
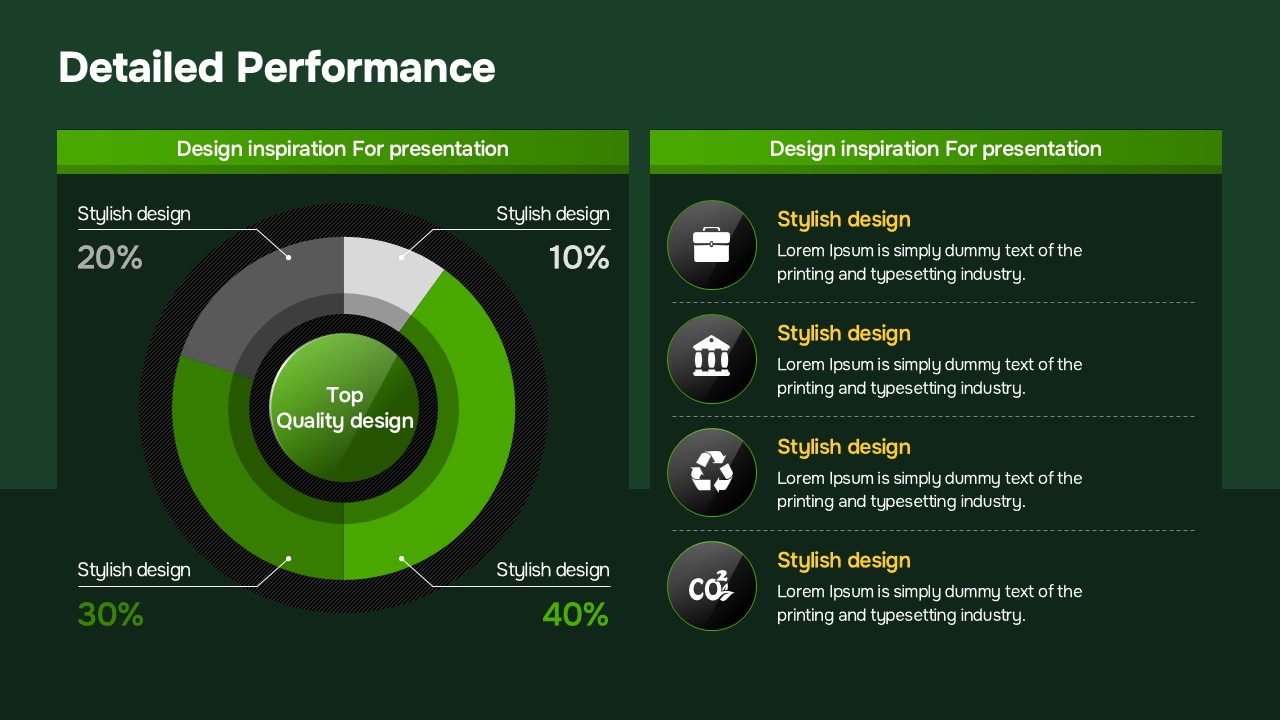
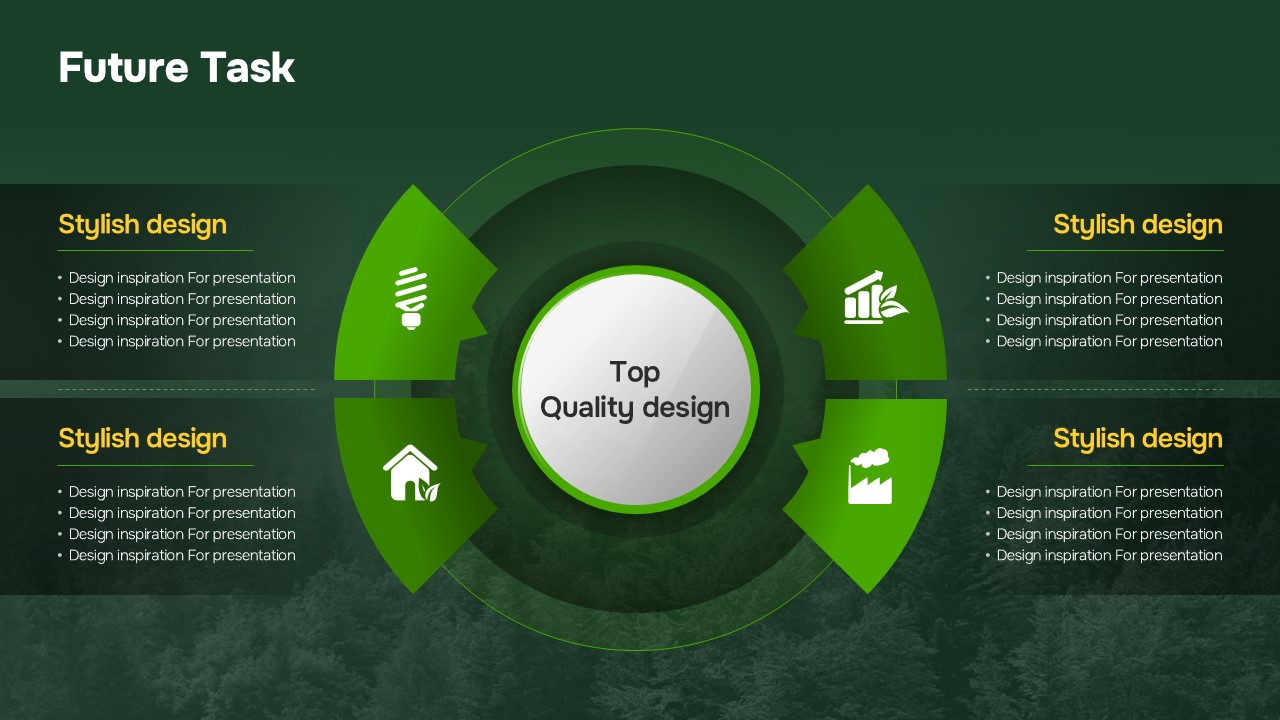
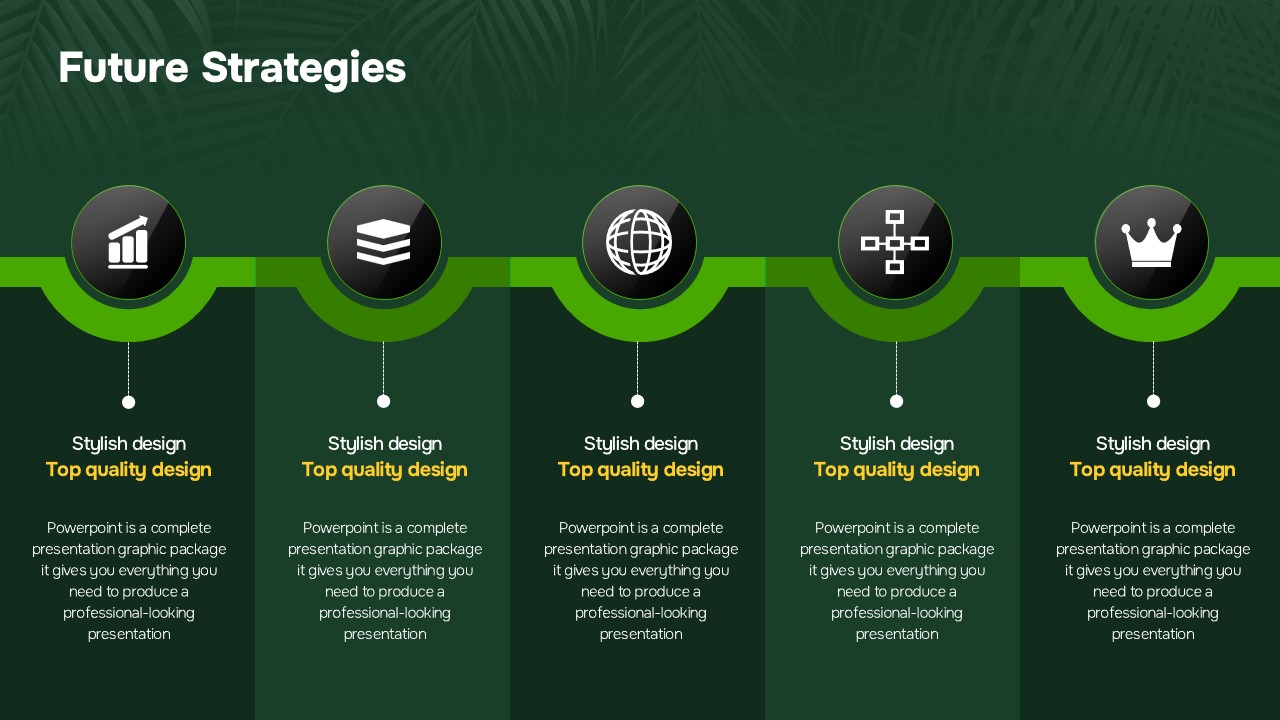
A professional business report PowerPoint template built on a dark green background with lime green and gold accent colors, designed for environmental, sustainability, and ESG-focused presentations. This 20-slide deck covers all essential sections of a business performance report: background and needs analysis, future strategies, detailed performance metrics, business systems, progress timelines, action plans, and business direction. Key slides include a donut chart for performance visualization, a 5-step horizontal timeline for strategic phases, a 2×3 icon card grid for action planning, and a circular diagram for system structure. Provided as an editable PPTX file, all text, colors, and images can be freely customized. Replace the placeholder content with your actual data and deliver a polished, professional presentation immediately.
Usage Points
-
Main Usage
Designed to present environmental and sustainability business performance to executives, investors, and stakeholders in a structured and visually compelling format using a professional dark green slide deck.
-
How to Use
Select the appropriate slide for each section—background, strategy, performance, action plan, and direction—then replace the donut chart figures, timeline stage labels, and icon card text with your actual business data to complete the presentation.
-
Recommended For
Ideal for ESG managers, sustainability report writers, environmental consultants, and corporate professionals who need to present green business performance or strategic direction to internal or external audiences.
-
Slide Structure
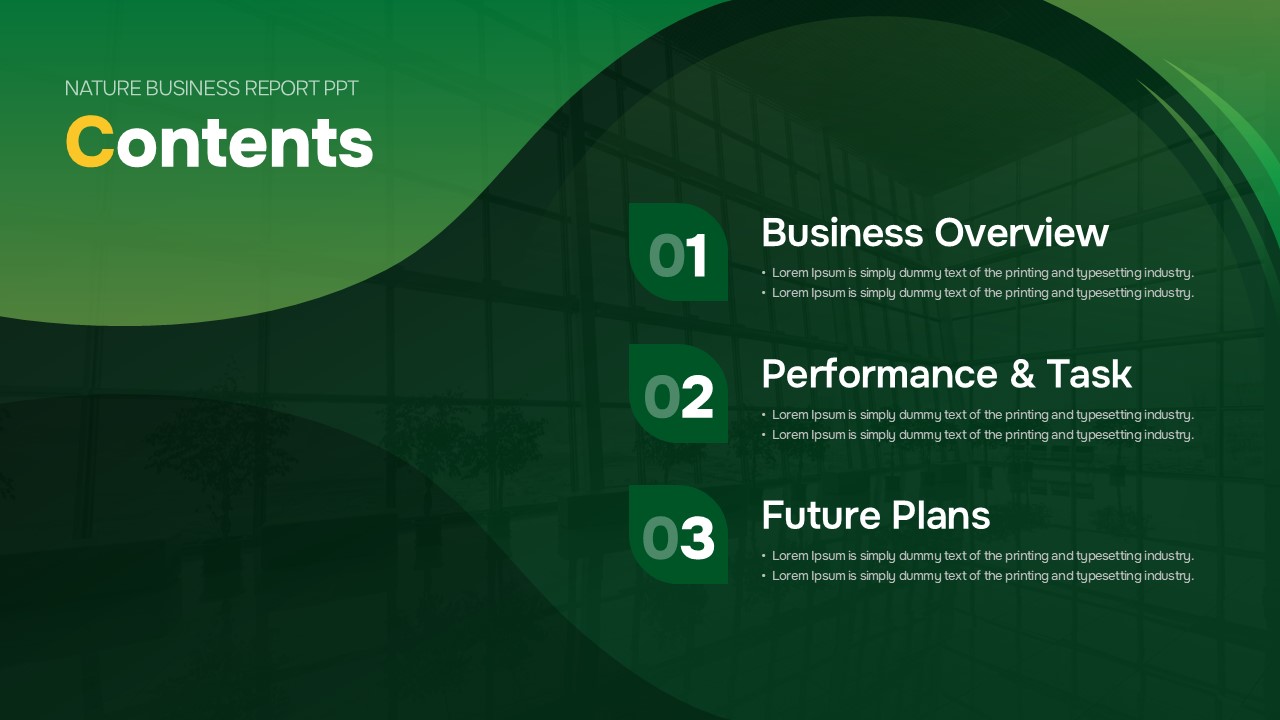
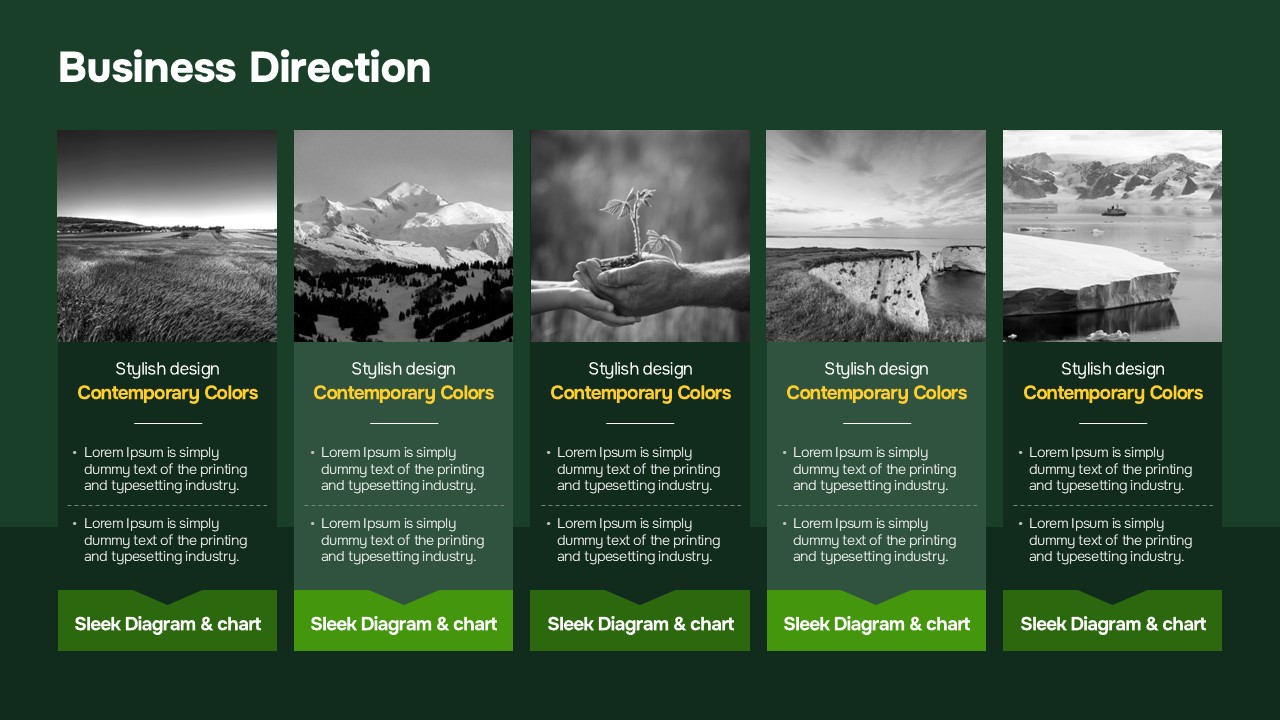
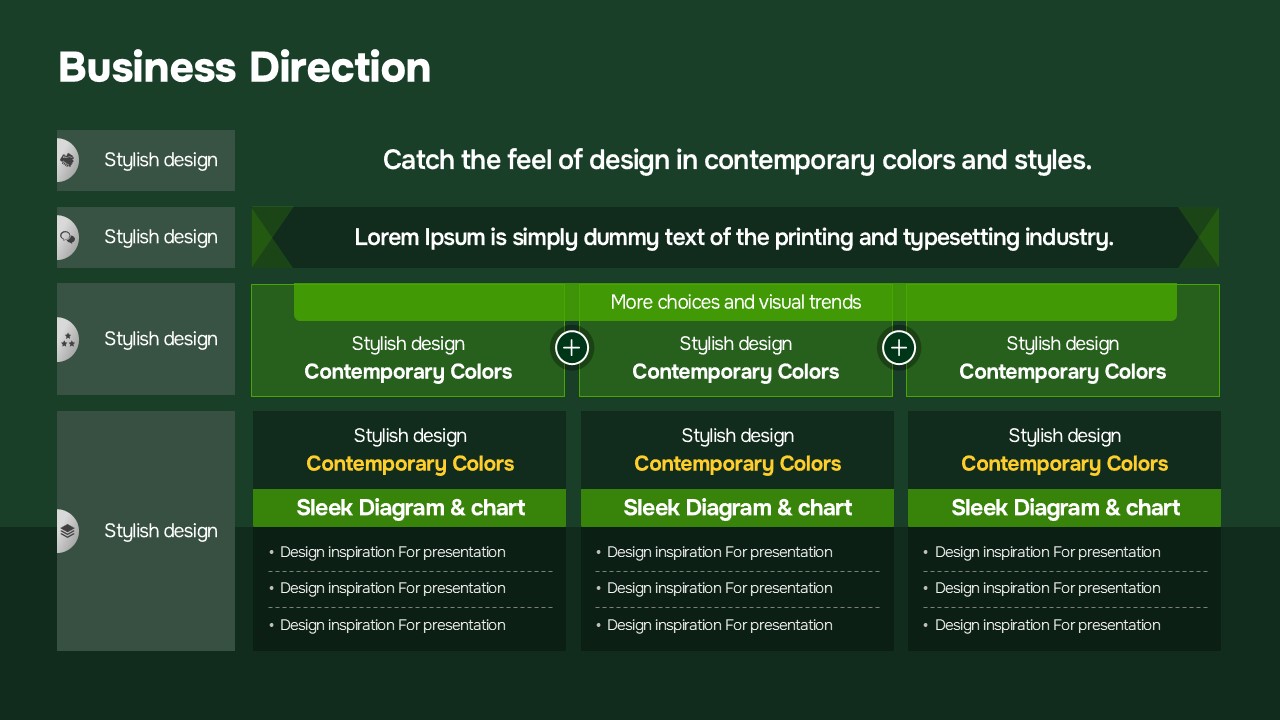
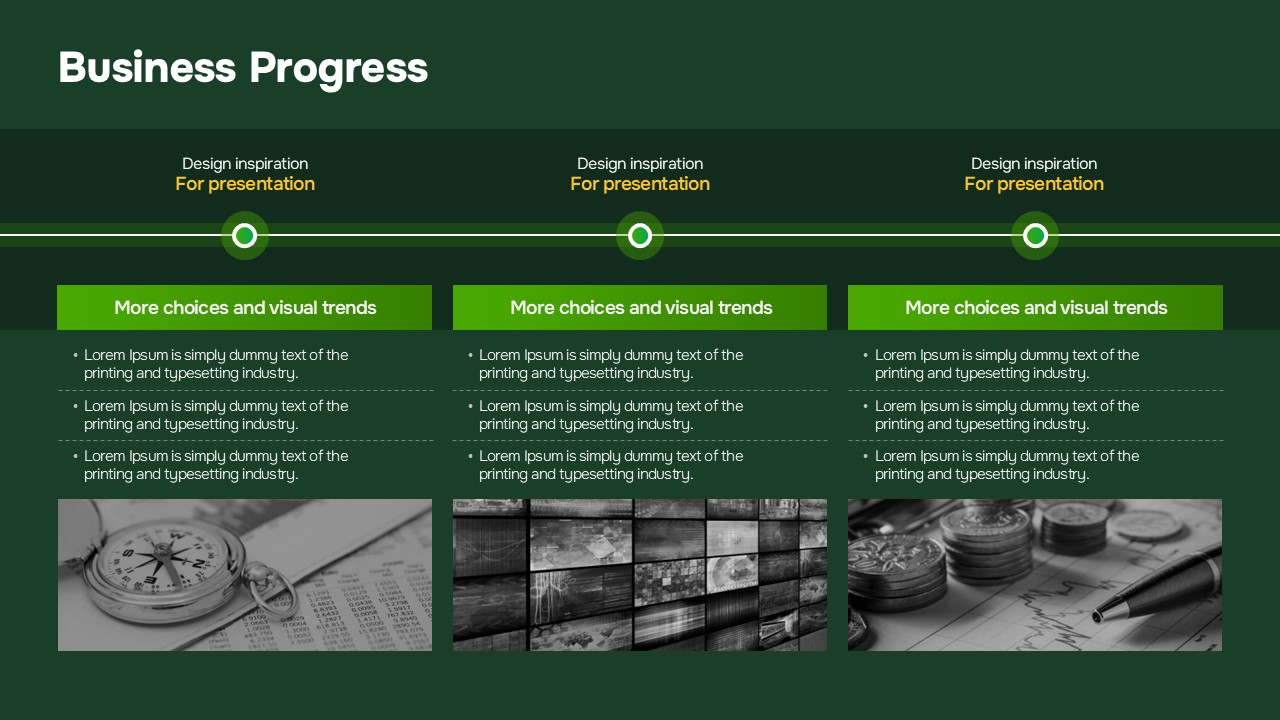
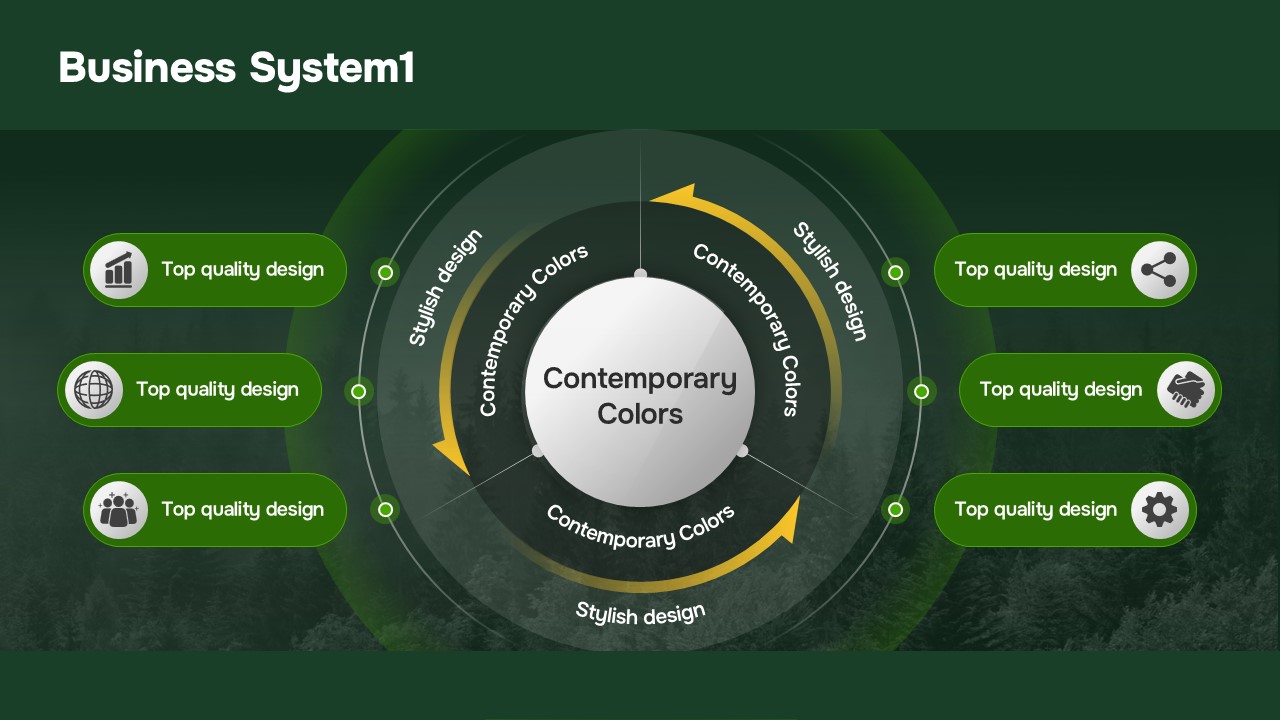
Cover (Nature Business Report) → Background & Needs (cluster icon diagram) → Future Strategies (5-step horizontal timeline) → Detailed Performance (donut chart + bullet list) → Business System (circular flow diagram) → Business Progress (3-column timeline with photos) → Detailed Action Plan (2×3 icon card grid) → Business Direction (4-row list + 3-column comparison table) — 20 slides total
Related Products
-

Curved Graphics Business Report PowerPoint Template – Modern Design and Elegant Colors
#Business/Performance Report
-

Modern Grid Business Report Template - Sleek and Intuitive Design
#Business/Performance Report
-

Business/Performance Report Template – Professional and Sleek Design
#Business/Performance Report
-

Business Report PowerPoint Template – Green & Black Simple Design
#Business/Performance Report
