Note Illustration Theme US Map & Graph – Market Analysis and Strategy Introduction
RJ0300045_11
- Last Update 04/30/2025
- File Size 0.4MB
- # of Slides 2
- File Format PPTX
- Slide Ratio 16:9
- Color
Keywords
- #Content-Based Slides
- #Design-Based Slides
- #Market and Competitor Analysis
- #Marketing Plan and Strategy
- #Graph
- #Other
- #Target Market
- #Target Market Strategy
- #Column
- #Grouped Column
- #Map
- #16:9
- #US map PowerPoint slide
- #map chart presentation
- #market analysis slide
- #horizontal bar chart PPT
- #regional data visualization
About the Product
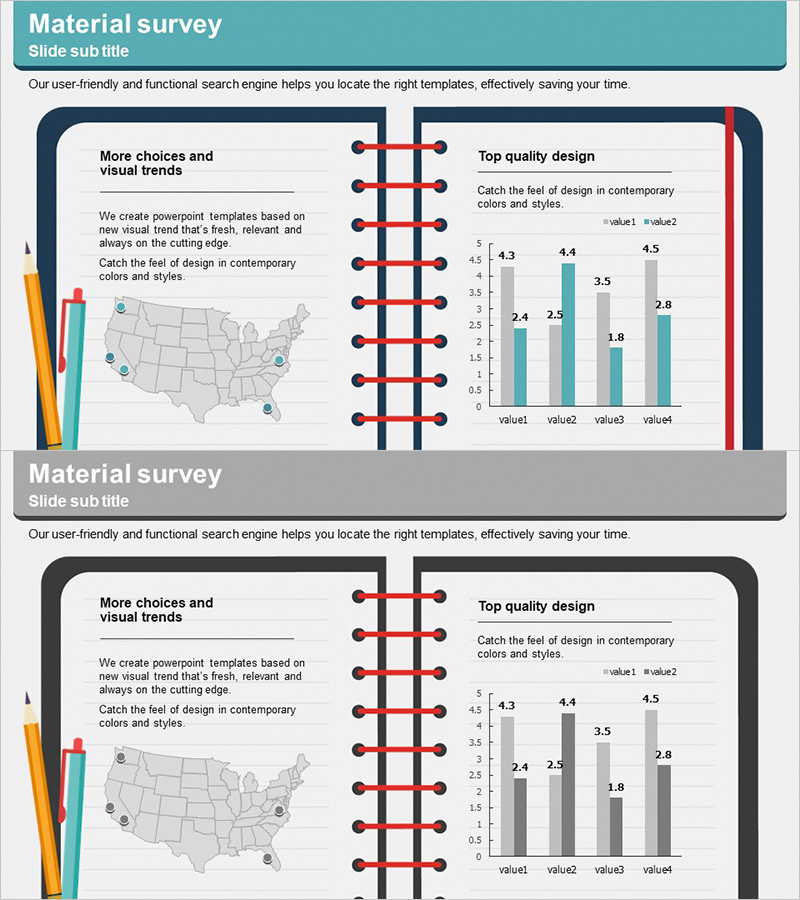
A 2-slide PowerPoint presentation combining a US regional map with horizontal bar chart data visualization. The left side features a US map with location markers indicating regional data points, while the right side displays a 4-item horizontal bar chart with dual data series. The note illustration theme uses warm tones—turquoise, coral, and gray—against a clean white background, creating clear separation between text and data areas. This slide deck is ready to use for market analysis presentations, regional performance comparisons, and strategic planning discussions in business settings.
Usage Points
-
Main Usage
Visualize US regional market data simultaneously on a map and bar chart to enable intuitive regional comparison analysis. Designed to clearly communicate regional market penetration strategy, regional performance status, and sales data distribution at a glance.
-
How to Use
On the first slide, click location markers on the US map to add regional information. On the second slide, edit the horizontal bar chart values to input actual data. Complete the presentation by adding title and description text in the note-themed text areas.
-
Recommended For
Marketing managers, sales directors, executives preparing regional reports, strategy presenters for market expansion, market research analysts, and business development professionals presenting regional data comparisons.
-
Slide Structure
Slide 1: US map (gray background) with 8 location markers (blue circles) and text area. Slide 2: 4-item horizontal bar chart (turquoise and gray dual series) with legend (value1, value2) and text area. Overall background follows the note illustration theme with clean white layout.
Related Products
-

Analysis of US Target Regions - Effective Market Exploration
#Market and Competitor Analysis #Marketing Plan and Strategy #Other
-

Asia-Focused Market Penetration Status - Data-Driven Market Analysis
#Market and Competitor Analysis #Marketing Plan and Strategy #Graph
-

Setting Target Area Goals in the United States - Marketing Strategies and Insights
#Market and Competitor Analysis #Marketing Plan and Strategy #Other
-

US Target Market Strategy – Data-Driven Market Analysis
#Market and Competitor Analysis #Marketing Plan and Strategy #Other
