Circular Graph Diagram for Business Introduction
RJ0300076_28
- Last Update 05/10/2025
- File Size 1.2MB
- # of Slides 2
- File Format PPTX
- Slide Ratio 16:9
- Color
Keywords
- #Content-Based Slides
- #Design-Based Slides
- #Company Introduction
- #Business Introduction
- #Diagram
- #Graph
- #Other
- #Business Areas
- #Business Areas
- #Spread
- #16:9
- #4-section circular diagram PowerPoint
- #circular graph slide design
- #business analysis diagram template
- #comparison slide PowerPoint
- #4-part value proposition slide
About the Product
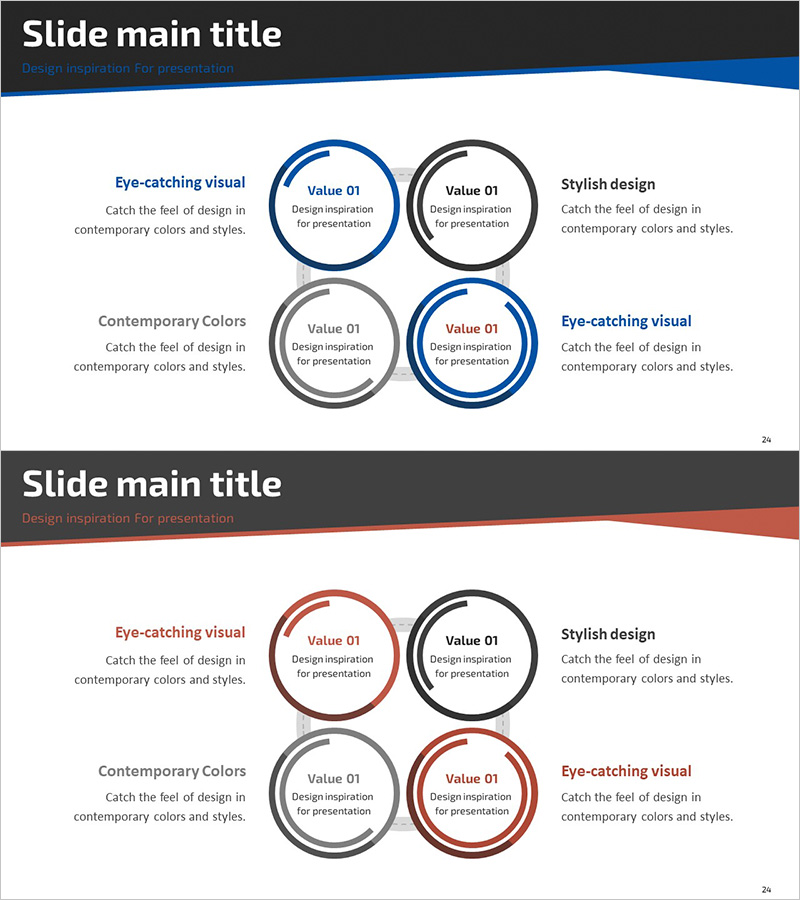
A professional circular diagram PowerPoint slide designed for business introductions and comparative analysis presentations. The 4-section circular layout features blue and red accent colors that highlight key values, capabilities, or business elements, with descriptive text areas positioned on both sides for detailed explanations. This 2-slide set enables clear visualization of business overview, competitive advantages, or strategic components in corporate presentations, investor pitches, and strategic planning meetings. Fully editable PPTX format allows quick customization for company profiles, market analysis, or organizational capability presentations.
Usage Points
-
Main Usage
Visualizes four key business elements, values, or capabilities using a circular diagram structure with blue and red accent colors. The layout emphasizes important items while providing dedicated text areas on both sides for comprehensive explanations of each section.
-
How to Use
Ideal for company overview presentations to showcase business divisions or core competencies, investor pitch decks to explain business model components, strategic planning meetings to present market analysis or competitive positioning, and marketing proposals to illustrate key value propositions.
-
Recommended For
Executive presentations, investor relations meetings, business development pitches, strategic planning sessions, marketing team reports, consulting proposals, and corporate communications requiring structured comparison of four key elements.
-
Slide Structure
2-slide set with each slide featuring a central 4-section circular diagram using blue, red, and gray accent colors. Header area accommodates title and subtitle, while left and right text zones provide space for detailed descriptions of each circular element, creating a balanced information hierarchy.
Related Products
-

Human Head Structure Diagram – Simple and Intuitive Visualization
#Company Introduction #Business Introduction #Diagram
-

Silhouette Diffusion 3D Diagram – Dynamic Business Structure Representation
#Company Introduction #Business Introduction #Diagram
-

Big Data Domain Triangle Diagram
#Company Introduction #Business Introduction #Diagram
-

Medical Business Area Diffusion Diagram – Efficient Connections
#Company Introduction #Business Introduction #Diagram
