Architectural Engineering Business Objectives Diagram – Strategic Goal Setting through Clustering
RJ0300034_12
- Last Update 04/27/2025
- File Size 5.6MB
- # of Slides 2
- File Format PPTX
- Slide Ratio 16:9
- Color
Keywords
- #Content-Based Slides
- #Design-Based Slides
- #Business Vision and Strategy
- #Marketing Plan and Strategy
- #Diagram
- #Business Goals
- #Marketing Objectives
- #Cluster
- #Chain Diagram
- #16:9
- #cluster diagram PowerPoint
- #3-node connection diagram
- #icon diagram slide
- #relationship diagram template
- #how to create cluster diagram in PowerPoint
About the Product
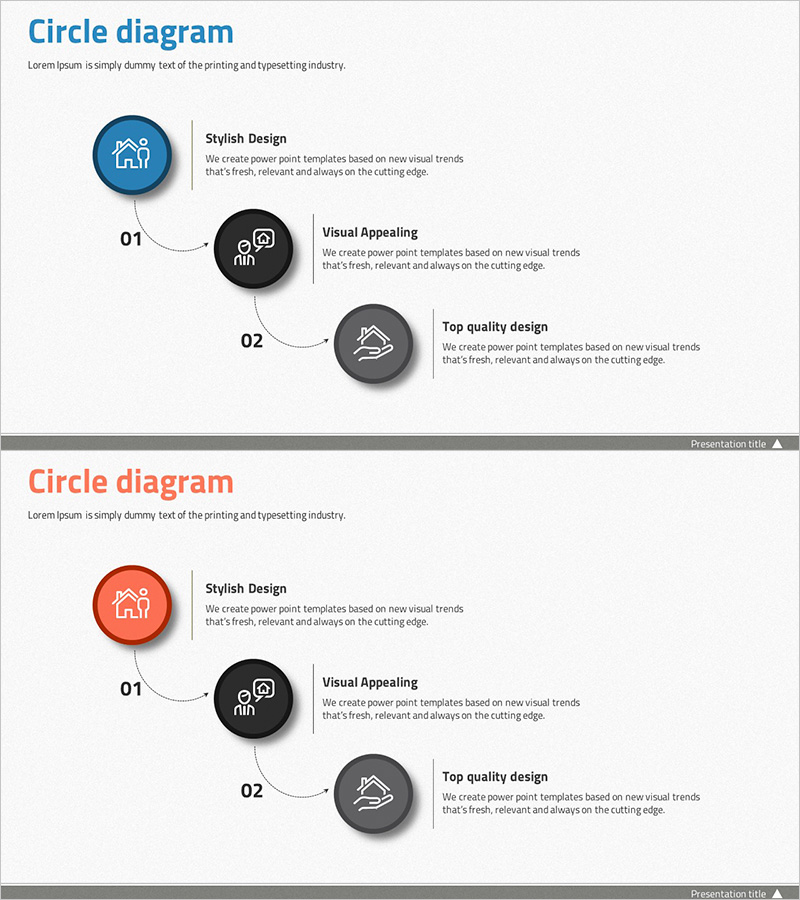
A cluster diagram PowerPoint slide featuring three circular nodes connected by arrows in a linear flow. The nodes are styled in dark blue, black, and gray tones with icons inside each circle, and text description areas positioned beside each node. This design effectively visualizes relationships between three related elements such as business objectives, strategic initiatives, and implementation methods. The slide set includes two variations with different color schemes (blue tone and red tone), allowing you to match your corporate branding and presentation theme.
Usage Points
-
Main Usage
Visually represents relationships and connections between three related elements such as business objectives, strategic initiatives, and implementation methods. Effectively communicates departmental roles within organizations, project phase relationships, core value interactions, and strategic alignments in a clear, structured format.
-
How to Use
Replace the icons and text within each circular node with your own content. Add detailed descriptions in the text boxes beside each node. Use the color variation slides to emphasize different aspects of your message. Customize node colors to match your corporate brand identity and presentation guidelines.
-
Recommended For
Ideal for executives, planning teams, marketing departments, and project managers presenting business strategies, goal-setting frameworks, organizational structures, and process connections. Highly effective for investor presentations, strategic planning meetings, organizational restructuring announcements, and new business initiative pitches.
-
Slide Structure
Slide 1: Dark blue-toned 3-node cluster diagram with top-left blue node → center black node → bottom-right gray node connected by arrows. Slide 2: Red-toned version with identical structure. Each node accommodates icon insertion; text description areas positioned to the right of each node.
Related Products
-

Marketing Objectives Triangle Diagram – For Business Strategy
#Business Vision and Strategy #Marketing Plan and Strategy #Diagram
-

Diagram Introducing Business Objectives by Area
#Business Vision and Strategy #Marketing Plan and Strategy #Diagram
-

Marketing Goals Connection Diagram – Presenting Business Vision
#Business Vision and Strategy #Marketing Plan and Strategy #Diagram
-

Clothing Service Marketing Goals – Modern Design
#Business Vision and Strategy #Marketing Plan and Strategy #Diagram
