User Usage Analysis Diagram – Insights in Graphs
RJ0300059_29
- Last Update 05/04/2025
- File Size 1.2MB
- # of Slides 2
- File Format PPTX
- Slide Ratio 16:9
- Color
Keywords
- #Content-Based Slides
- #Design-Based Slides
- #Market and Competitor Analysis
- #Graph
- #Customer Analysis
- #Other
- #Scatter Plot
- #16:9
- #infographic PowerPoint slide
- #user analysis presentation
- #ratio analysis diagram
- #customer demographics template
- #gender statistics slide
- #dot chart PowerPoint
- #data visualization slide
About the Product
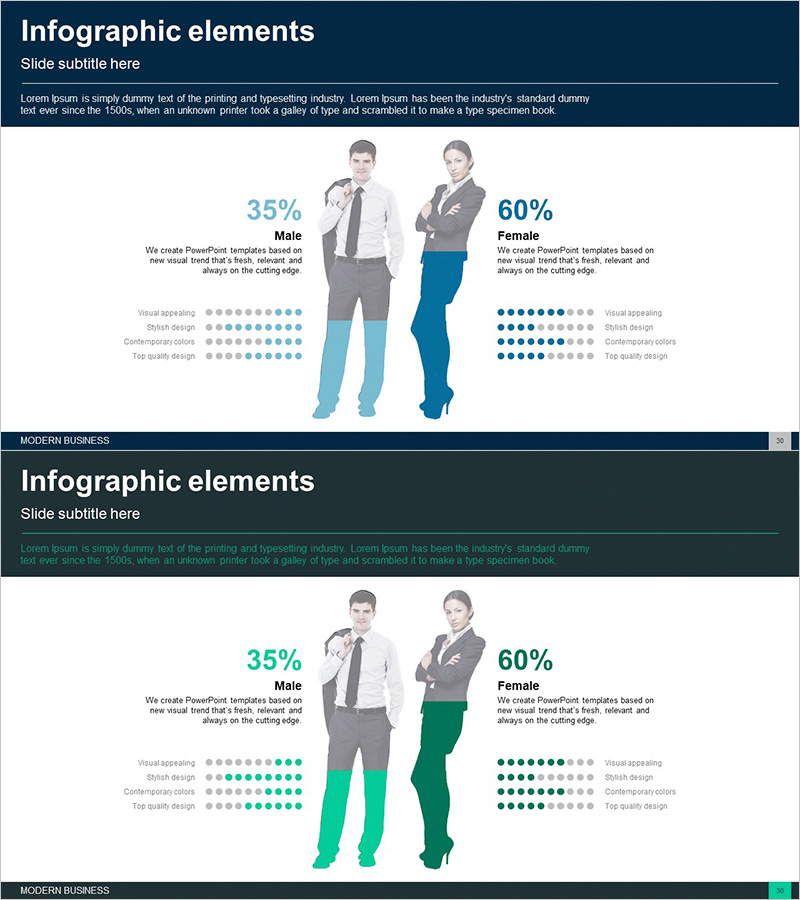
A visually compelling PowerPoint slide template that presents user demographics and behavioral analysis through infographic silhouettes. The design features male and female silhouettes with percentage values (35%, 60%) prominently displayed, complemented by a dot-matrix chart below showing evaluation metrics across four categories. The dark blue header contrasts sharply with the white background, ensuring clear data communication. Ideal for customer analysis, market research presentations, and gender-based usage reports. The 2-slide set includes color variations (blue and green) that can be customized to match your brand guidelines and presentation style.
Usage Points
-
Main Usage
Visualize demographic data, user behavior patterns, and comparative metrics using silhouettes and percentage-based infographics. Effectively communicate customer segmentation, market research findings, and statistical comparisons to stakeholders. The silhouette-based design enhances audience comprehension and engagement during presentations.
-
How to Use
Replace the sample percentages (35%, 60%) with your actual data values. Update the four evaluation metric labels (Visual appealing, Stylish design, Contemporary colors, Top quality design) to match your analysis categories. Select either the blue or green color variant to align with your corporate branding, then insert into your presentation deck.
-
Recommended For
Marketing teams presenting customer analysis reports, executive-level market research briefings, HR departments sharing employee satisfaction surveys, consulting firms delivering client analysis, startups pitching user behavior insights, and business analysts presenting demographic breakdowns.
-
Slide Structure
Two-slide template with consistent layout: dark blue header section for titles, white content area featuring two centered silhouettes with percentage labels, and a four-category dot-matrix evaluation chart at the bottom using gray and blue dot indicators. Color variants available in blue and green palettes for brand customization.
Related Products
-

Bundled Vertical Bar Graph Blue Green – Market and Customer Analysis
#Market and Competitor Analysis #Financial Plans and Performance #Graph
-

Customer Share Analysis Chart – Insights for Successful Business
#Market and Competitor Analysis #Graph #Other
-

A Diagram of a Soccer Game – Sports Strategy Analysis
#Product/Service Introduction #Market and Competitor Analysis #Diagram
-

Customer Type Analysis Slide – Focusing on Market Share
#Market and Competitor Analysis #Graph #Other
