Puzzle Shape Diagram for Visualizing Business Areas – Connection and Cluster
RJ0300059_20
- Last Update 05/04/2025
- File Size 0.8MB
- # of Slides 2
- File Format PPTX
- Slide Ratio 16:9
- Color
Keywords
- #Content-Based Slides
- #Design-Based Slides
- #Company Introduction
- #Business Introduction
- #Diagram
- #Business Areas
- #Business Areas
- #Cluster
- #Chain Diagram
- #16:9
- #puzzle diagram PowerPoint
- #cluster diagram slide template
- #business area connection chart
- #interconnected elements slide
- #organizational structure diagram
- #service portfolio visualization
About the Product
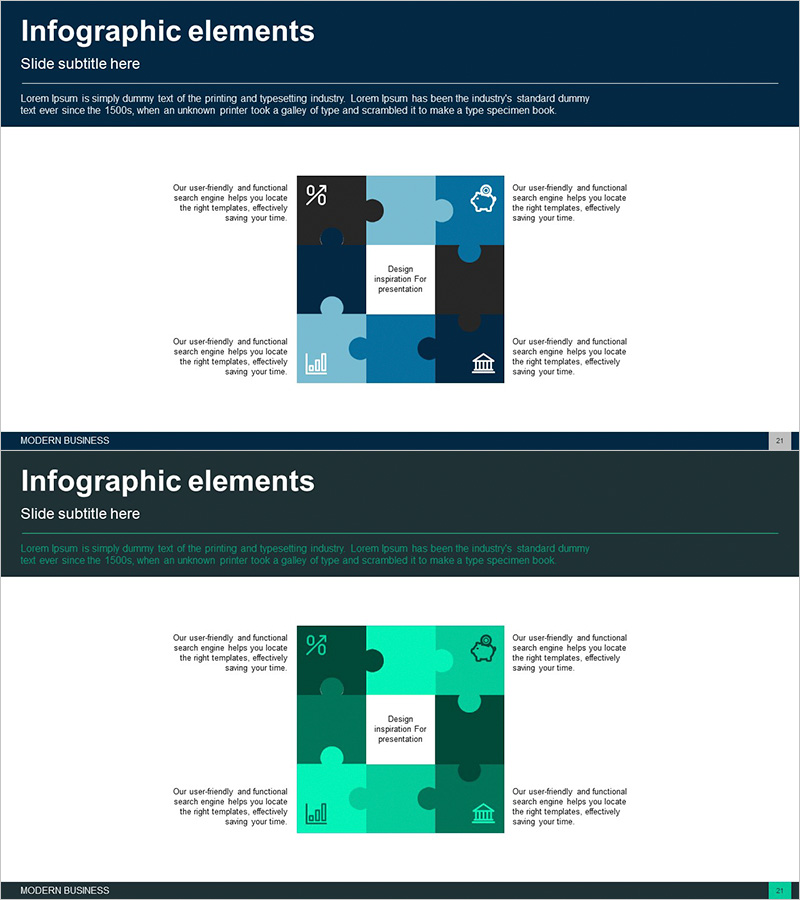
A cluster diagram PowerPoint slide that visualizes interconnected business areas using puzzle piece shapes. Four color variations—dark blue, light blue, dark green, and light green—are arranged around a central message box, with dedicated icon and text areas in each piece. This design effectively communicates how different business units, departments, or service offerings connect and depend on each other. Ideal for company introductions, business overviews, organizational structures, and service portfolio presentations. The 2-slide set includes a color variant, delivered in 16:9 widescreen PPTX format for immediate editing and customization.
Usage Points
-
Main Usage
Illustrates how multiple business units, departments, or service lines interconnect and support each other. The puzzle metaphor emphasizes integration, interdependence, and the completeness of a unified business ecosystem or organizational structure.
-
How to Use
Insert this slide into company overview presentations to show core business divisions or departmental relationships. Replace placeholder text and icons with your specific business area names and corresponding symbols. The two-slide format allows you to choose between color schemes that match your brand identity.
-
Recommended For
Executives, business strategists, marketing teams, and organizational development professionals presenting to investors, board members, or new employees. Particularly effective for large corporations with diverse business portfolios, consulting firms, IT companies, and financial institutions in company introductions and strategic business plans.
-
Slide Structure
Slide 1 features a dark blue background with four puzzle pieces (light blue, dark green, light green, and a fourth color) arranged around a central white message box. Each piece contains dedicated areas for icons and text. Slide 2 provides a color variant with a dark green palette, allowing flexibility in brand color alignment.
Related Products
-

Business Area Flower Diagram – Ideal for Company Introductions
#Company Introduction #Business Introduction #Diagram
-

Core Business Area Diagram – Segmentation and Expansion
#Company Introduction #Business Introduction #Diagram
-

Fountain Pen Business Area Diagram – Visualized Cluster Structure
#Company Introduction #Business Introduction #Diagram
-

Diffusion Diagram Without Center – Effective Business Introduction
#Company Introduction #Business Introduction #Diagram
