Business Process Connection Diagram – Visualizing Business Strategy
RJ0300054_14
- Last Update 05/02/2025
- File Size 2.6MB
- # of Slides 2
- File Format PPTX
- Slide Ratio 16:9
- Color
Keywords
- #Content-Based Slides
- #Design-Based Slides
- #Business Strategy
- #Operational Plan
- #Diagram
- #Step-by-Step Schedule Plan
- #Business Processes
- #Cluster
- #Chain Diagram
- #16:9
- #connection diagram PowerPoint
- #process flow diagram slide
- #4-step diagram template
- #business process visualization
- #how to create process diagram in PowerPoint
About the Product
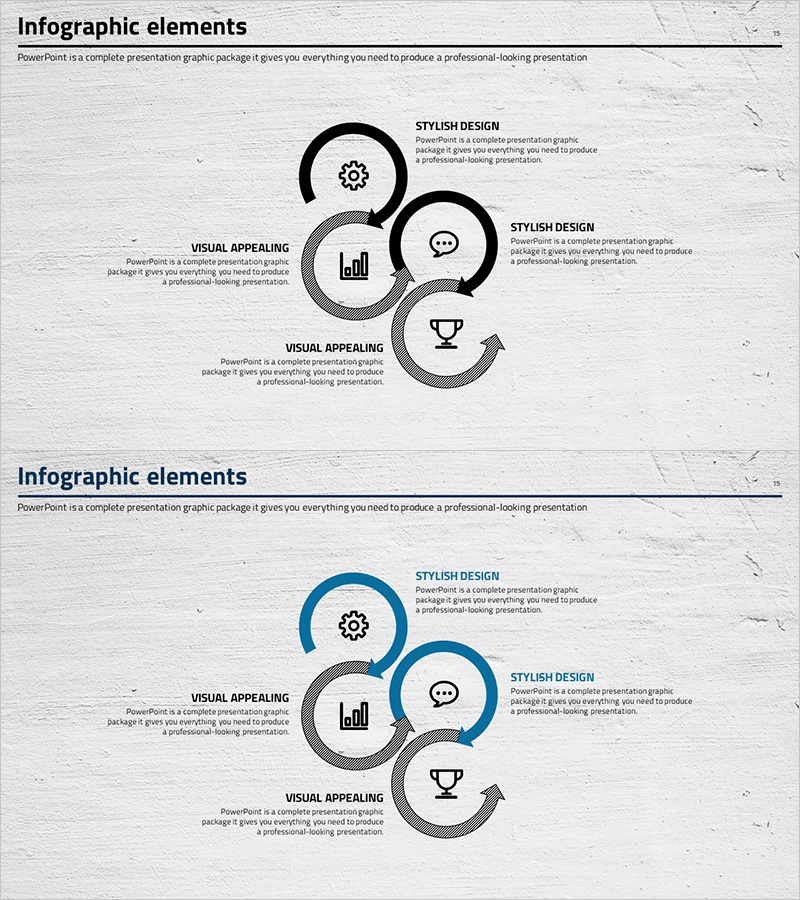
A process diagram PowerPoint slide featuring four circular nodes connected in an arc formation, radiating from a central hub. This design is optimized for visualizing business processes, strategic initiatives, and cross-functional relationships. Each node includes an icon placeholder and text area for customization. Two color versions are provided: monochrome and blue-toned variants. Perfect for presentations, business plans, and reports that require clear process flow representation.
Usage Points
-
Main Usage
Visualizes business processes, strategic initiatives, and cross-functional relationships using a four-node structure. The radial design emphasizes the central concept with surrounding elements, making it ideal for strategy presentations, project management, and organizational restructuring announcements.
-
How to Use
Enter process names, department responsibilities, and timelines in each node's text area. The arc-shaped connectors highlight relationships between stages, allowing you to represent sequential workflows, parallel processes, and feedback loops effectively.
-
Recommended For
Executives, planning teams, project managers, and organizational development professionals presenting business strategies, organizational structures, and process workflows. Suitable for executive meetings, strategic presentations, organizational announcements, and project kickoff sessions.
-
Slide Structure
Two-slide set. Slide 1: Monochrome 4-node connection diagram with central hub and four surrounding nodes connected by arc lines. Slide 2: Identical structure in blue-toned version with blue upper arc and gray-toned nodes. Each node includes icon placeholder and text input area.
Related Products
-

Game Business Process Diagram - Visualization of Business Strategy
#Business Strategy #Operational Plan #Diagram
-

Social Network Business Process Diagram - Strategic Planning
#Business Strategy #Operational Plan #Diagram
-

4STEP Connection Diagram – Business Strategy Presentation
#Business Strategy #Operational Plan #Diagram
-

Visualizing Daily Work Processes – Effective Operational Planning
#Business Strategy #Operational Plan #Diagram
