Business Meeting Analysis Graph – Visualization for Achieving Business Goals
RJ0300042_29
- Last Update 04/29/2025
- File Size 0.9MB
- # of Slides 2
- File Format PPTX
- Slide Ratio 16:9
- Color
Keywords
About the Product
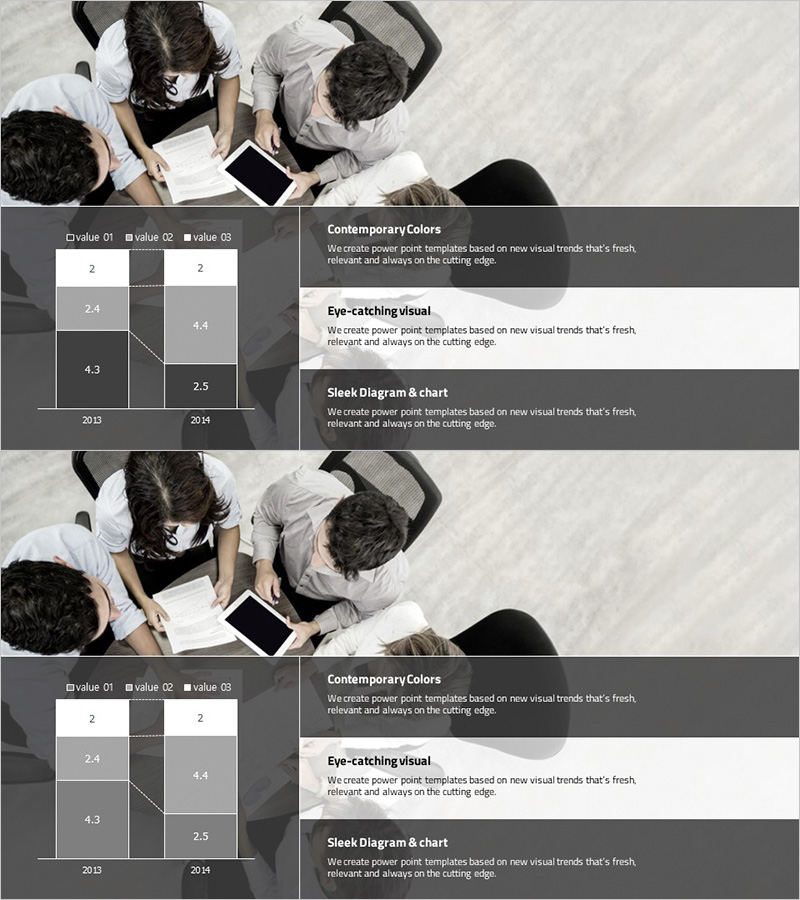
A professional PowerPoint slide designed for business meetings and data-driven presentations. The slide features a charcoal gray background with white typography, presenting a segmented comparison chart that visualizes three metrics across two fiscal years (2013 and 2014). The left section displays a legend with value indicators (01, 02, 03) and corresponding data points, while the right side includes three descriptive text blocks: 'Contemporary Colors', 'Eye-catching visual', and 'Sleek Diagram & chart'. This 2-slide presentation template is ready for immediate use in quarterly reports, performance reviews, and strategic planning sessions where numerical comparison and trend analysis are essential.
Usage Points
-
Main Usage
Visualizes year-over-year numerical comparisons and data trend analysis for business presentations. Ideal for quarterly performance reports, market analysis, financial summaries, and strategic reviews where quantitative data clarity is critical.
-
How to Use
Input actual numerical data into the left chart area and add interpretive insights or key findings in the right text sections. The high-contrast charcoal and white color scheme ensures excellent readability in conference rooms, auditoriums, and various presentation environments.
-
Recommended For
Finance teams, marketing departments, strategy divisions, and business analysts. Recommended for quarterly earnings reports, executive briefings, investor presentations, and business performance analysis documents.
-
Slide Structure
2-slide template with each slide divided into left segmented chart (2 years × 3 metrics = 6 data points) and right text box with 3 descriptive sections. 16:9 widescreen PPTX format compatible with modern presentation platforms and devices.
Related Products
-

Business Goal Analysis Graph – Realizing Business Vision
#Business Vision and Strategy #Market and Competitor Analysis #Diagram
-

Setting and Analyzing Business Goals – Effective Marketing Strategy
#Business Vision and Strategy #Marketing Plan and Strategy #Graph
-

Arctic Business Market Analysis Chart by Year – Visualizing Business Goals
#Business Vision and Strategy #Market and Competitor Analysis #Diagram
-

Planet Illustration Diagram – Visualizing Business Strategy
#Business Vision and Strategy #Business Strategy #Diagram
