Setting and Analyzing Business Goals – Effective Marketing Strategy
RJ0300074_19
- Last Update 05/09/2025
- File Size 0.1MB
- # of Slides 2
- File Format PPTX
- Slide Ratio 16:9
- Color
Keywords
- #Content-Based Slides
- #Design-Based Slides
- #Business Vision and Strategy
- #Marketing Plan and Strategy
- #Graph
- #Text Box
- #Business Goals
- #Marketing Objectives
- #Column
- #Segmented Column
- #Rectangle Text Box
- #16:9
- #vertical bar chart PowerPoint
- #bar graph slide template
- #data comparison presentation
- #trend analysis chart
- #marketing performance visualization
About the Product
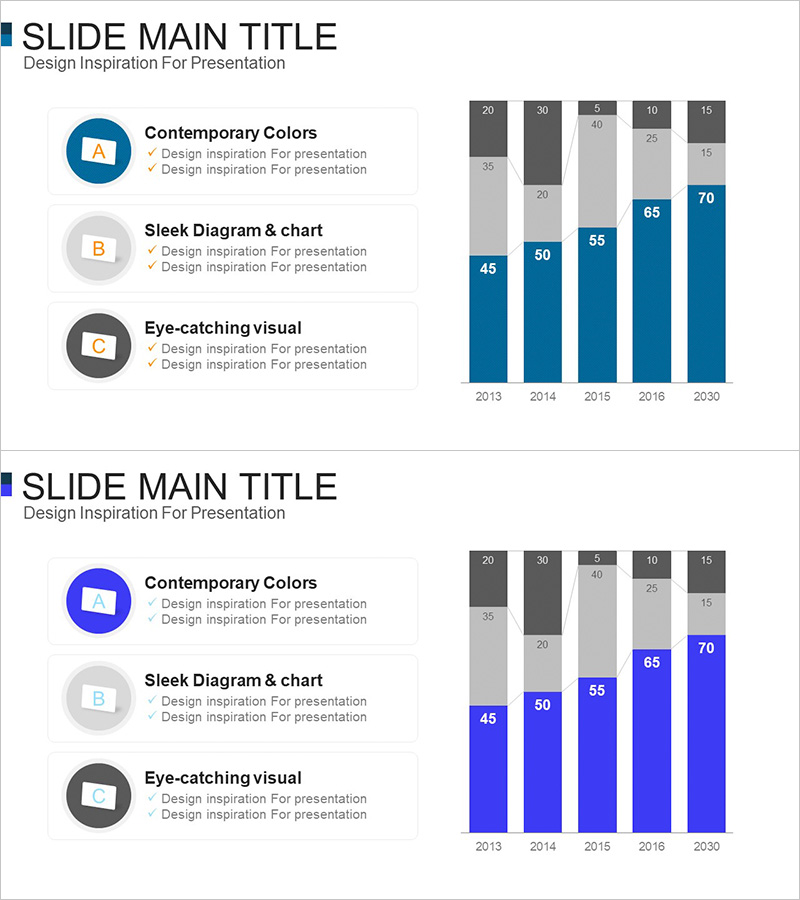
A vertical bar chart PowerPoint slide designed to visualize business goal achievement and marketing performance across five years (2013–2030). The slide features a dark blue and gray color scheme with precise numerical values displayed above each bar for enhanced data readability. The left side includes three key items (Contemporary Colors, Sleek Diagram & chart, Eye-catching visual) with accompanying icons to structure your presentation content. In 16:9 widescreen format with 2 slides, this template is ready to edit and suitable for marketing strategy presentations, business performance reports, goal achievement analysis, and quarterly reviews.
Usage Points
-
Main Usage
Ideal for comparing year-over-year, quarterly, or monthly numerical trends using a vertical bar chart format. Visualizes business goal achievement and marketing performance metrics quantitatively. The dark blue color palette emphasizes credibility and professionalism, while numerical labels above each bar ensure precise data communication.
-
How to Use
Use in executive reports, quarterly performance presentations, marketing campaign result analysis, and business planning sessions to compare targets against actual results. Customize the three left-side items with your key strategies or initiatives, and replace the chart data with your actual figures to create a tailored presentation.
-
Recommended For
Marketing managers, business planning teams, executives, sales managers, and consultants who need quantitative data analysis and performance reporting. Particularly effective for presentations involving goal setting, progress tracking, achievement evaluation, and data-driven decision-making.
-
Slide Structure
Two-slide template with each slide divided into two sections: a left panel containing three item areas (icon + text) and a right panel with a vertical bar chart. The chart displays five bars representing years 2013, 2014, 2015, 2016, and 2030, with numerical values labeled above each bar and supplementary data in the upper area. Color coding uses dark blue, gray, and light gray to represent data hierarchy.
Related Products
-

Design Inspiration Slide Template – A Tool for Professional Presentations
#Business Vision and Strategy #Marketing Plan and Strategy #Text Box
-

Memo Shape Diagram – Perfect for Business Vision and Marketing Strategy
#Business Vision and Strategy #Marketing Plan and Strategy #Diagram
-

Setting Goals for Business Growth – Vision and Marketing Strategy
#Business Vision and Strategy #Marketing Plan and Strategy #Diagram
-

Business Goal Linkage Diagram – Strategic Connection and Collaboration
#Business Vision and Strategy #Marketing Plan and Strategy #Diagram
