Business Sales and Profit Statement - Financial Performance Visualization
RJ0300042_28
- Last Update 04/29/2025
- File Size 0.4MB
- # of Slides 2
- File Format PPTX
- Slide Ratio 16:9
- Color
Keywords
- #Content-Based Slides
- #Design-Based Slides
- #Company Introduction
- #Financial Plans and Performance
- #Diagram
- #Company Overview
- #Sales and Revenue
- #Table
- #16:9
- #financial performance table PowerPoint
- #sales profit slide deck
- #financial data table PPT
- #business financial visualization slides
- #investor presentation financial template
About the Product
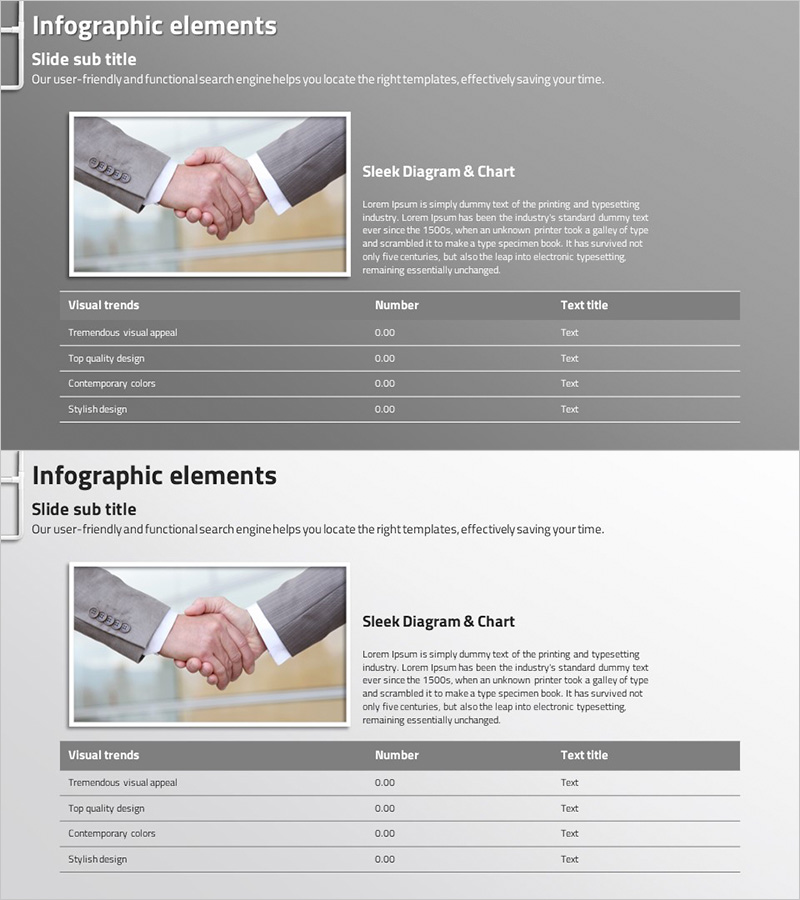
A 2-slide PowerPoint presentation designed to visualize business financial performance with clarity and professionalism. The gray-toned background with a handshake image creates a trustworthy atmosphere, while the right-side layout accommodates sales, profit, and visual trend data in table format. The balanced composition of left image area and right text-chart section is ideal for investor presentations, financial reports, and business performance briefings. Slide 1 features a handshake-centered diagram layout; Slide 2 contains a 4-row data table structure optimized for numerical decision-making and financial analysis.
Usage Points
-
Main Usage
Present core financial metrics—sales, profit, and visual trends—in a structured table format to investors, employees, and business partners. The gray-toned background and handshake imagery reinforce business credibility and financial stability, making it ideal for high-stakes financial communications.
-
How to Use
Add your company logo or key message to Slide 1's image area. Input actual sales and profit figures into the 'Sleek Diagram & Chart' section on the right. On Slide 2, populate the data table with quarterly or annual financial figures to highlight visual trends. The 16:9 widescreen format is optimized for projector displays and online presentations.
-
Recommended For
CFOs, financial officers, and investor relations managers preparing IR materials, quarterly earnings presentations, and financial reports. Also suitable for business plans, proposals, loan applications, and investment pitch decks requiring financial data visualization.
-
Slide Structure
Slide 1: Left handshake image (trust element), right text area (3 rows) + chart section for sales, profit, and trends. Slide 2: 4-row data table (Visual trends / Number / Text title headers + 4 data rows). Total 2 slides, 16:9 aspect ratio, PPTX format.
Related Products
-

Colors Theme Presentation Template Table – Financial Planning and Performance
#Financial Plans and Performance #Diagram #Sales and Revenue
-

Annual Sales and Profit Table – Clearly Presenting Financial Plans
#Financial Plans and Performance #Diagram #Capital Requirements
-

Sugar Content by Fruit – Revenue Performance Analysis
#Product/Service Introduction #Financial Plans and Performance #Diagram
-

Yearly Sales and Profit Statement – Financial Visualization
#Market and Competitor Analysis #Financial Plans and Performance #Diagram
