Instrument Nesting Connection Diagram – Add a Unique Touch to Your Presentation
RJ0500020_32
- Last Update 06/12/2025
- File Size 0.6MB
- # of Slides 2
- File Format PPTX
- Slide Ratio 16:9
- Color
Keywords
- #Content-Based Slides
- #Design-Based Slides
- #Product/Service Introduction
- #Business Introduction
- #Diagram
- #Benefits and Advantages
- #Business Areas
- #Cluster
- #Combination Diagram
- #Chain Diagram
- #16:9
- #overlapping connection diagram PowerPoint
- #5-node diagram template
- #circular cluster slide
- #business relationship diagram
- #interconnected elements PPT
About the Product
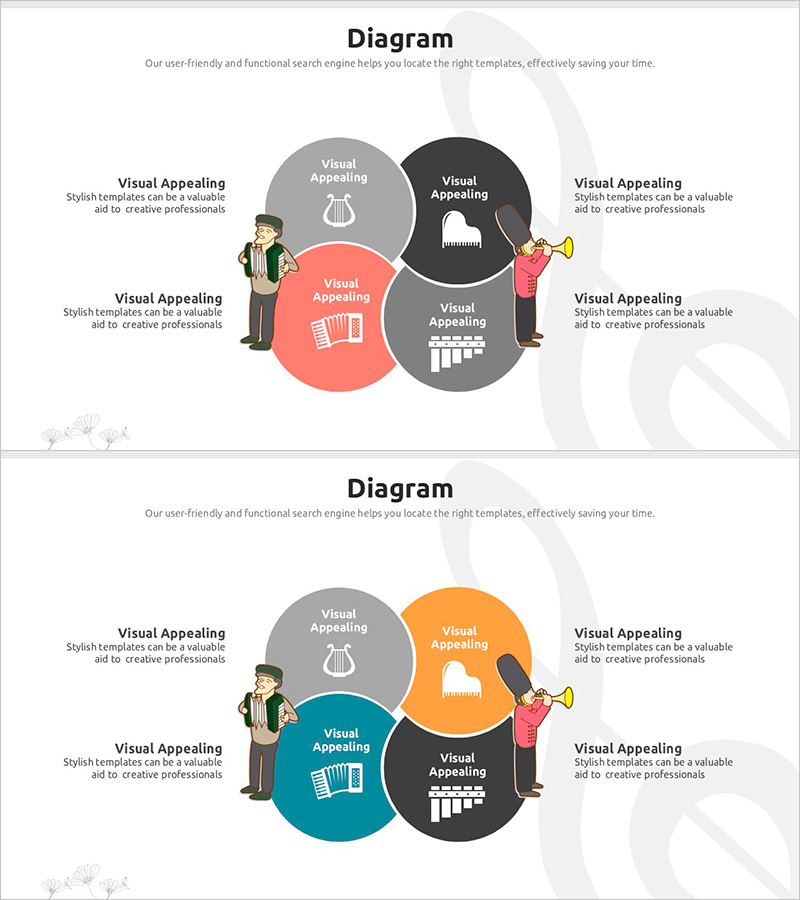
A PowerPoint slide featuring a 5-node overlapping connection diagram with instrument icons (harp, piano, trumpet, keyboard) positioned within circular nodes. The central red node is surrounded by gray, black, and orange nodes that overlap and interconnect, creating a layered relationship structure. Character illustrations and text areas on both sides enhance presentation appeal. This 2-slide 16:9 PPTX template is ideal for business presentations, educational seminars, and marketing proposals to visualize relationships between multiple elements, integrated concepts, or collaborative frameworks.
Usage Points
-
Main Usage
Effectively visualizes interconnected relationships between multiple elements with a central concept surrounded by overlapping peripheral nodes. The layered structure communicates integration, fusion, and interaction concepts. Instrument icons make it adaptable for music, arts, creativity, and cultural presentation topics.
-
How to Use
Enter topic names or item labels in each node's text area and customize icons as needed. Add explanations and conclusions using the character illustrations and side text areas. Adjust colors to match corporate branding and use both slides to present different relationship scenarios or comparative diagrams.
-
Recommended For
Marketing proposals, business pitches, educational seminars, organizational culture presentations, creative workshops, music and arts-related content, and cultural events. Suitable for product portfolios, service integration structures, team collaboration models, and creative process explanations.
-
Slide Structure
Central red node (core concept) surrounded by four overlapping nodes in gray, black, and orange tones, creating a 5-node configuration. Each circular node contains white icons and text labels. Character illustrations and descriptive text areas are symmetrically positioned on both sides, with 2 complete slide layouts provided.
Related Products
-

Business Area Overlap Diagram – Integration of Strategy and Vision
#Business Introduction #Business Vision and Strategy #Diagram
-

Business Core Competency Overlay Diagram – Effective Strategy Delivery
#Product/Service Introduction #Business Vision and Strategy #Diagram
-

Business Area Overlay Diagram – A Blend of Visual Appeal and Functionality
#Company Introduction #Business Introduction #Diagram
-

Identity Wide Template – Overlapping Diagram Usage
#Product/Service Introduction #Diagram #Differentiation Strategy for Products/Services
