Future Space Business Sector Diagram – Visualizing Business Strategy and Vision
RJ0700020_26
- Last Update 07/27/2025
- File Size 1.1MB
- # of Slides 2
- File Format PPTX
- Slide Ratio 16:9
- Color
Keywords
- #Content-Based Slides
- #Design-Based Slides
- #Business Vision and Strategy
- #Marketing Plan and Strategy
- #Diagram
- #Business Strategy
- #Marketing Strategy
- #Cluster
- #Chain Diagram
- #16:9
- #cluster diagram PowerPoint
- #infinite connection diagram slide
- #4-node diagram template
- #business strategy visualization PPT
- #relationship diagram PowerPoint
- #how to create cluster diagram in PowerPoint
About the Product
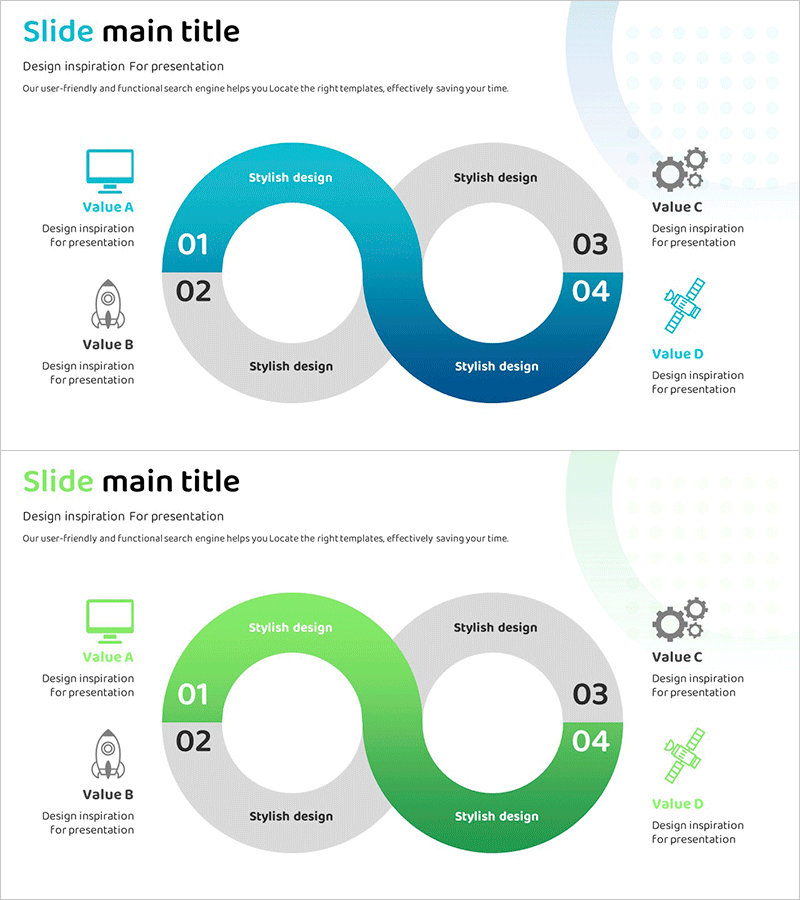
An infinite connection cluster diagram PowerPoint slide that visualizes business strategy and vision. The design features a teal-to-dark-blue gradient effect with neutral gray nodes representing four interconnected elements. Each node includes an icon and text area for clearly distinguishing business sectors, strategic components, or vision items. The 2-slide set provides color variations (teal and green), optimized for 16:9 widescreen format. Ready to use in presentations with fully editable text and icons for customization.
Usage Points
-
Main Usage
Effectively communicates interconnected relationships and circular structures among four key elements such as business strategy, vision, core values, or marketing components. The infinite connection design emphasizes continuous growth, circular economy, or integrated systems, making it ideal for company presentations, business plans, and strategic briefings.
-
How to Use
Enter business sector names, strategic elements, or vision items in each node's text area. Replace icons with images representing each component's characteristics. The gradient coloring can emphasize priority levels. Add slide animations to present each node sequentially during your presentation.
-
Recommended For
Business strategists, marketing planners, executives, and investment pitch creators. Particularly suitable for future-oriented sectors like space, technology, energy, and finance. Effective for explaining integrated management systems, circular business models, and comprehensive organizational vision.
-
Slide Structure
Two-slide set with teal gradient version (emphasizing nodes 01, 02, 04) and green gradient version. Each slide features a central infinite-loop 4-node cluster, two value icons on the left (Value A, B), and two on the right (Value C, D). Balanced composition optimized for 16:9 widescreen format with ample white space.
Related Products
-

Space Business Strategy Connection Diagram – Vision of Innovation
#Business Vision and Strategy #Marketing Plan and Strategy #Diagram
-

Big Data Business Strategy Connection Diagram
#Business Vision and Strategy #Marketing Plan and Strategy #Diagram
-

Corporate Strategy Diagram Leading the Future – Visualizing Business Flow
#Business Vision and Strategy #Marketing Plan and Strategy #Diagram
-

Space Exploration Strategy Connection Diagram
#Business Vision and Strategy #Marketing Plan and Strategy #Diagram
