Business Promotion Strategy
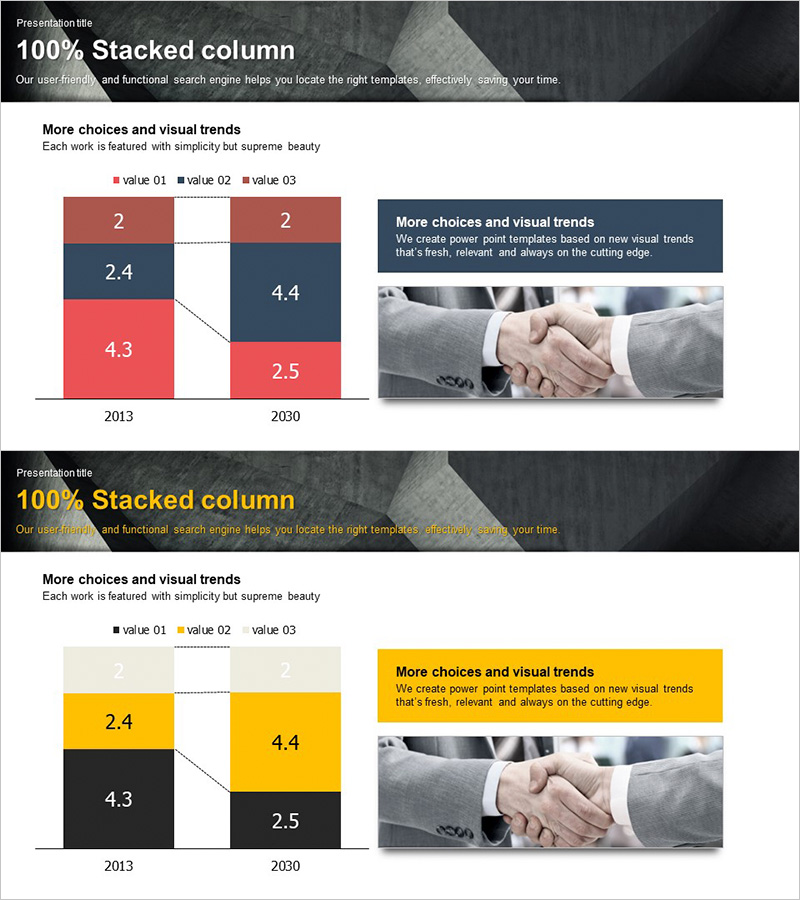
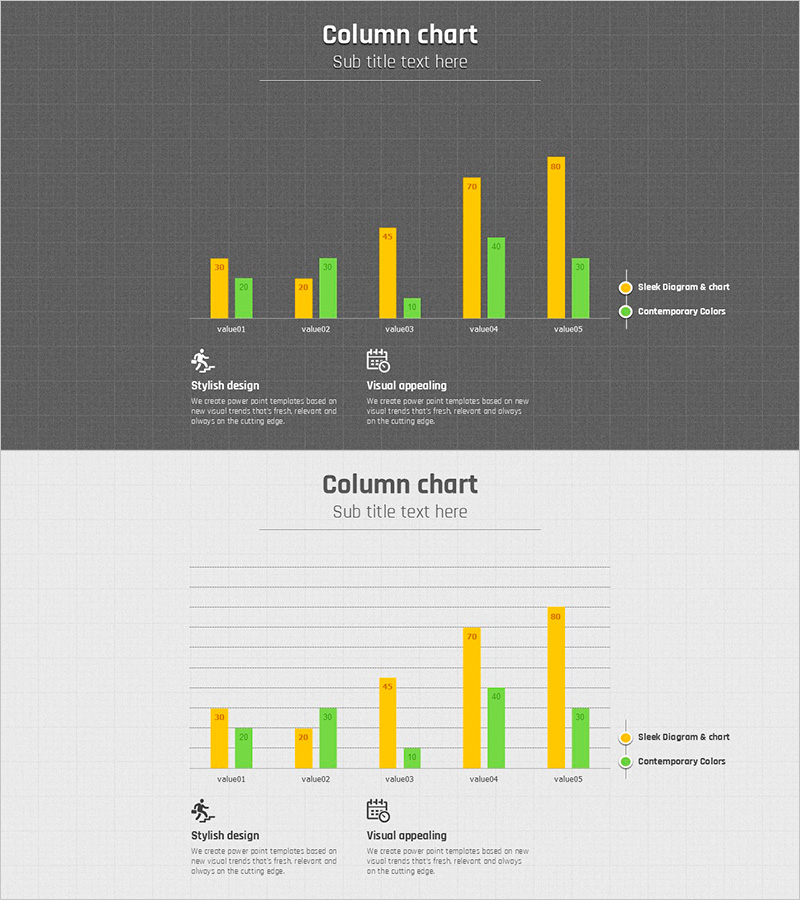
Business Performance Analysis Graph – Vertical Bars
RJ0300018_11
- Last Update 12/21/2025
- File Size 2.7MB
- # of Slides 2
- File Format PPTX
- Slide Ratio 16:9
- Color
Keywords
About the Product
This slide features a 100% stacked column chart suitable for effectively visualizing business performance. The combination of horizontal and vertical charts allows for comprehensive comparative analysis. Blending red, blue, and yellow colors adds a dynamic touch while showcasing a sleek and structured design. It is particularly effective for conveying business strategies and revenue forecasts. This slide simplifies complex data explanations, making it highly useful in practical environments. Text and data areas are easily modifiable, with an editing difficulty rated as 'easy', enabling anyone to leverage it effortlessly.
Related Products
-
Four Color Infographic Bar Chart Template – Visualize Your Competitive Advantage
#Market and Competitor Analysis #Graph #Competitor Analysis
-
Rhombus Template for Visualizing Business Strategies – Efficient Marketing and Promotion Plans
#Business Promotion Strategy #Marketing Plan and Strategy #Promotion Strategy
-
The Curve of Football Development - Market Analysis and Future Outlook
#Technology Sector #Market and Competitor Analysis #Graph
-
Plotting Paper Presentation Template Column Chart – Business Strategy Analysis
#Business Promotion Strategy #Market and Competitor Analysis #Graph
