Market and Competitor Analysis
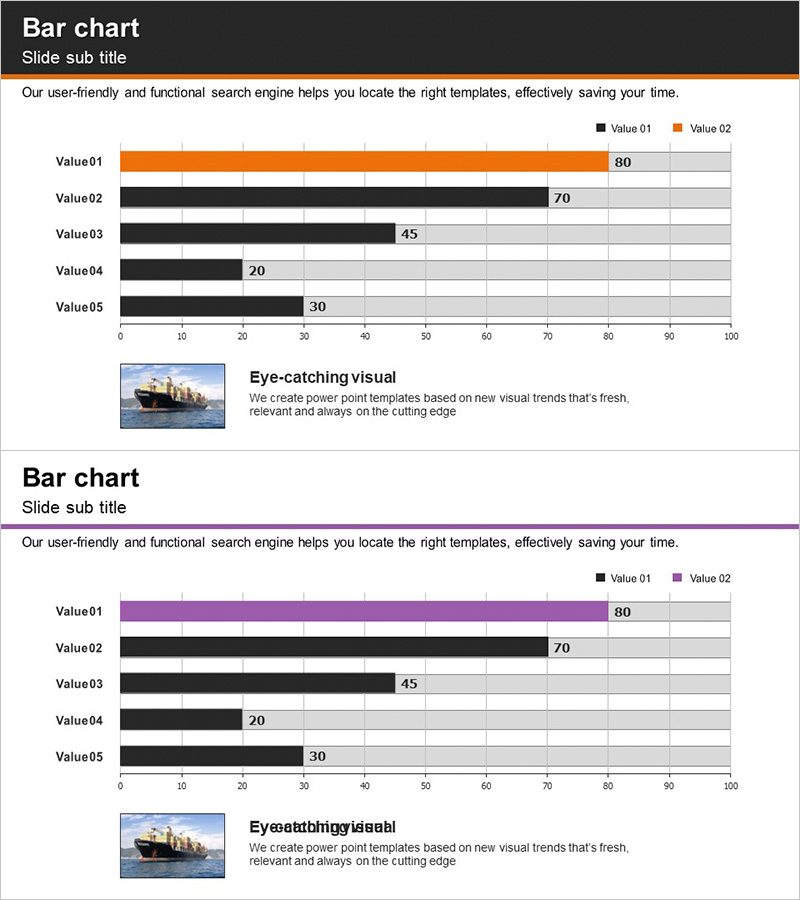
Trade Market Analysis Graph – Visualizing Market Status
RJ0300017_6
- Last Update 12/21/2025
- File Size 1.1MB
- # of Slides 2
- File Format PPTX
- Slide Ratio 16:9
- Color
Keywords
About the Product
This slide utilizes a horizontal bar graph to clearly compare various indicators of the trade market. With vibrant orange and violet tones, it features an easy-to-follow layout for effective information delivery, making it suitable for reports or proposals analyzing market performance. This visually appealing slide captures investors' attention and is easy to edit, enhancing its versatility. The editing difficulty is rated as 'easy', providing quick integration into various presentations.
Related Products
-
Travel Marketing Planning Chart – Market Share Analysis
#Market and Competitor Analysis #Diagram #Other
-

Alimony Ranking Graph – Visualizing Financial Performance
#Financial Plans and Performance #Graph #Other
-
Market Analysis Graph for Mobile Networks
#Market and Competitor Analysis #Graph #Other
-
Travel Business Competitor Analysis and Market Share – Doughnut Chart Based
#Market and Competitor Analysis #Graph #Market Share
