Business Promotion Strategy
Performance Graph by Year – Results and Future Outlook
RJ0300017_4
- Last Update 12/21/2025
- File Size 0.2MB
- # of Slides 2
- File Format PPTX
- Slide Ratio 16:9
- Color
Keywords
About the Product
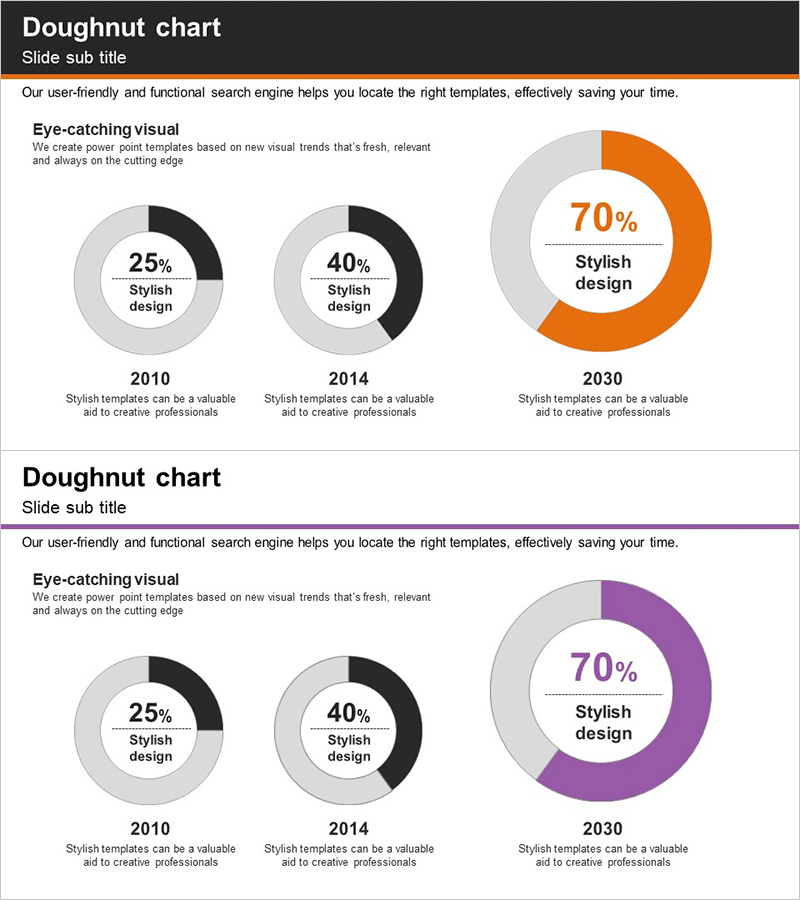
This slide utilizes a doughnut chart to clearly visualize performance by year. The contrasting colors of orange and purple allow for easy identification of performance across different years. It provides insights into results from 2010, 2014, and projections for 2030. This slide is particularly suited for business plans or strategy presentations, leaving a strong impression on the audience. The ease of editing text and graphs allows for immediate use in a variety of presentations.
Related Products
-
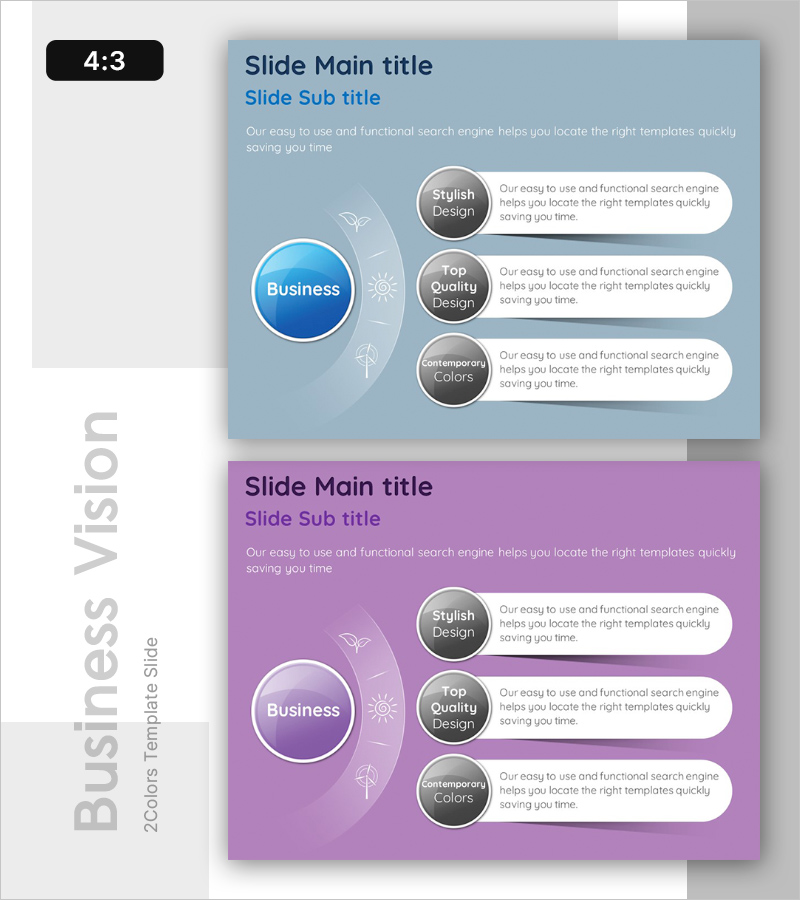
Three-Step Approach to Business Growth – Business Strategy and Implementation Background
#Business Vision and Strategy #Business Promotion Strategy #Diagram
-
Marking Milestones with Market Data – Market Status and Share
#Market and Competitor Analysis #Graph #Market Status
-
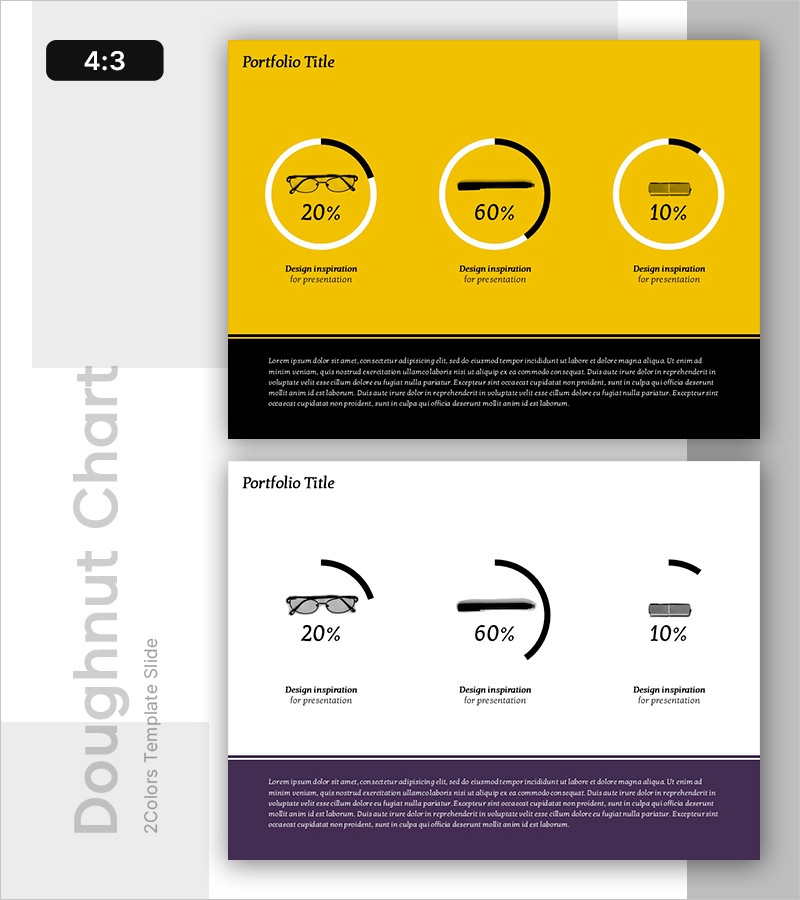
Demand Analysis by Item Using Donut Chart
#Market and Competitor Analysis #Graph #Market Status
-
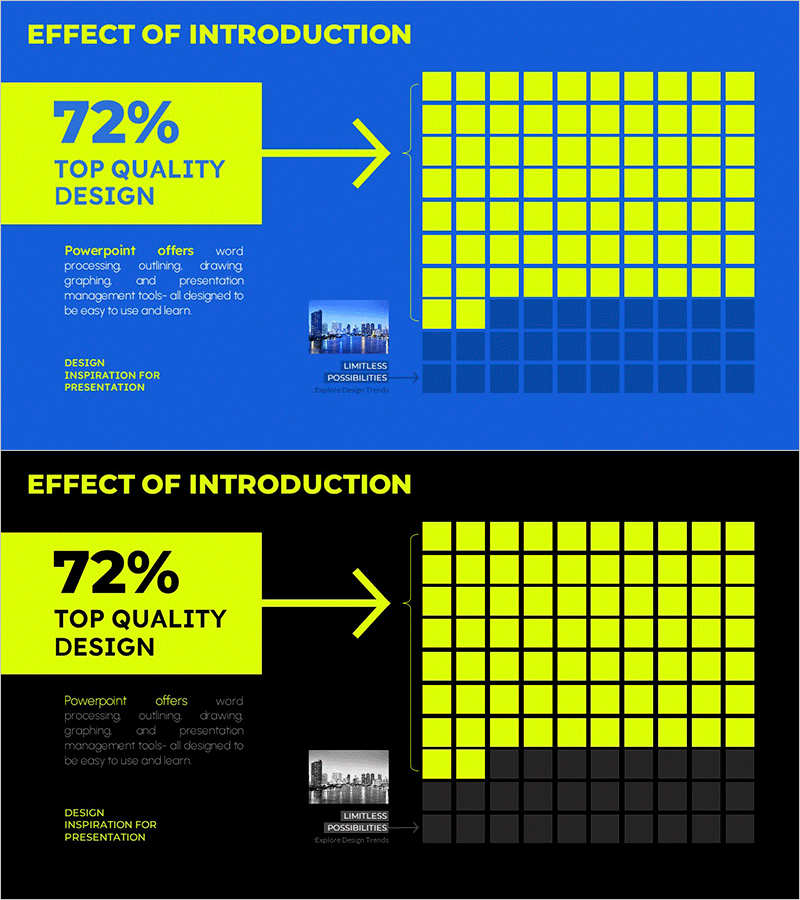
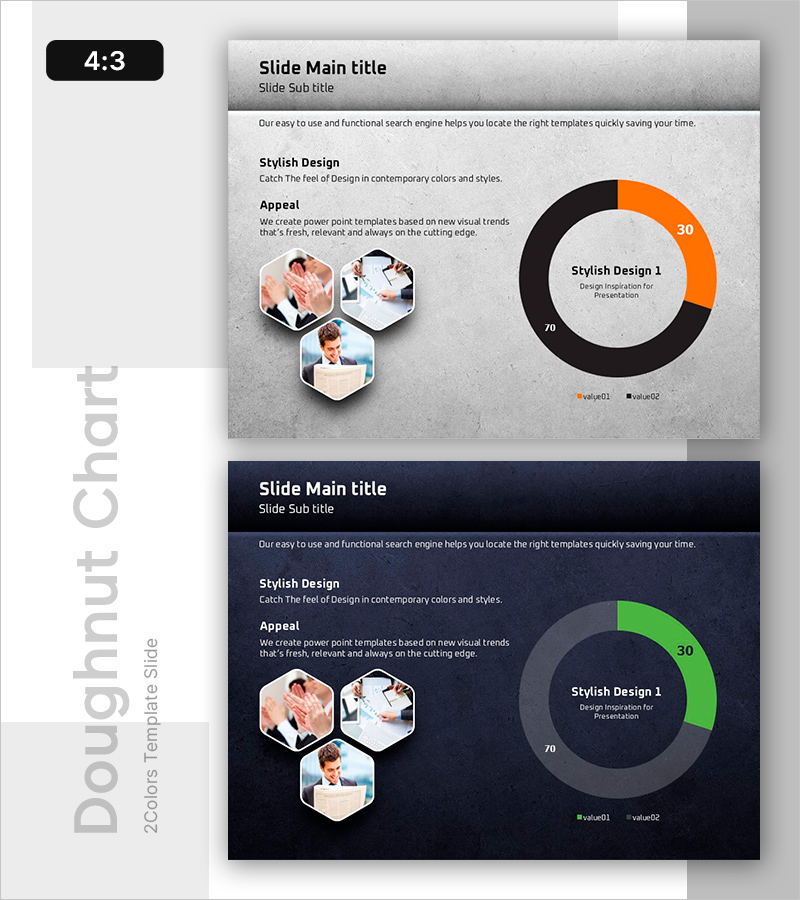
Introduction Effect Share Graph - Visualizing Business Success
#Business Promotion Strategy #Market and Competitor Analysis #Graph
