Business Promotion Strategy
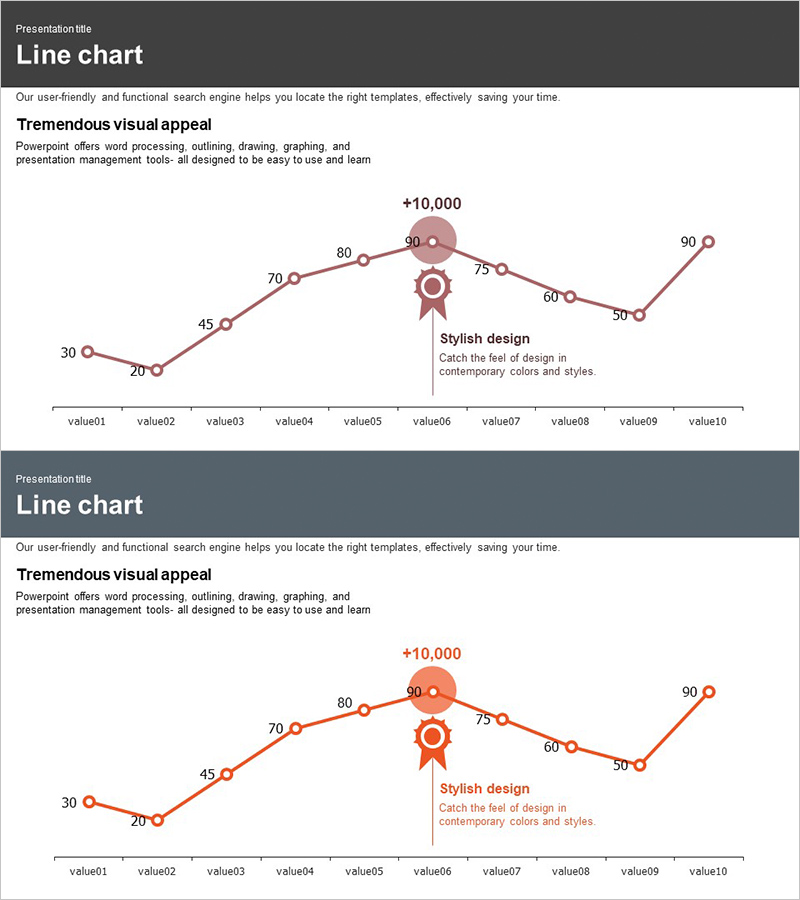
Market Analysis Broken Line Graph – Visualizing Business Performance
RJ0300009_19
- Last Update 12/21/2025
- File Size 0.2MB
- # of Slides 2
- File Format PPTX
- Slide Ratio 16:9
- Color
Keywords
About the Product
This slide features a broken line graph for analyzing market status, clearly illustrating performance fluctuations. Designed with a subdued color scheme (black, navy, gray), it projects a professional image suitable for various business environments. The slide visually separates two lines, effectively conveying competitive analysis results. ◇Editing difficulty is rated as 'easy', with the replaceable elements being graph values, allowing for quick data updates. This broken line graph can be utilized during recent market analysis reports or business performance presentations.
Related Products
-
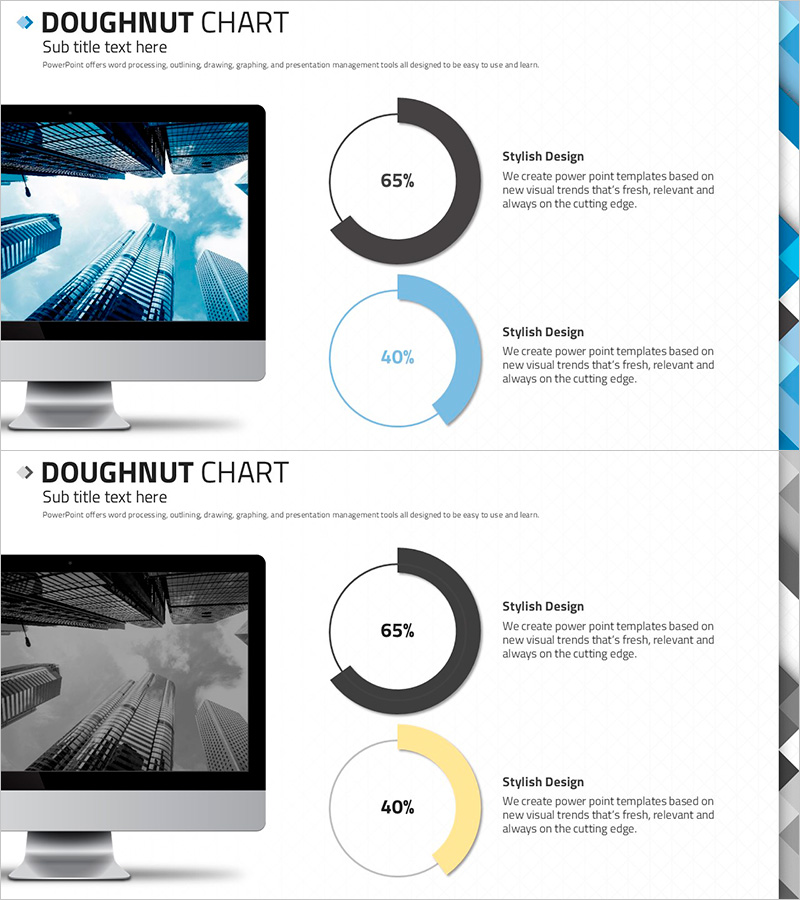
Doughnut Chart Template for Digital Marketing Strategy
#Company Introduction #Marketing Plan and Strategy #Graph
-

Main Business Analysis Graph – Performance Insights
#Company Introduction #Business Introduction #Diagram
-
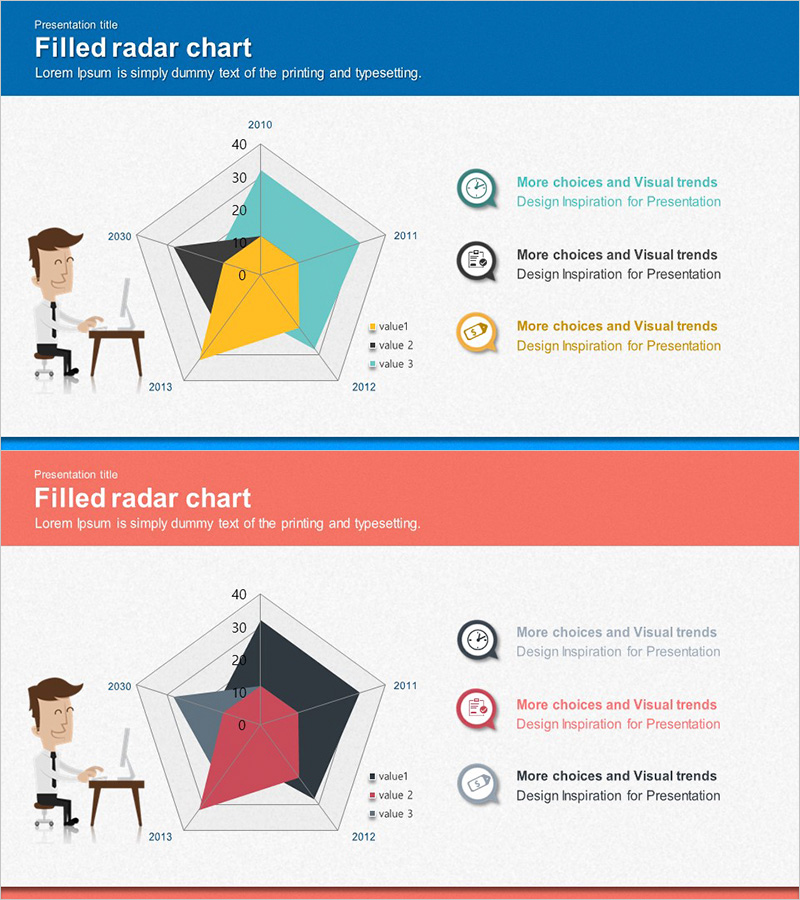
Radial Graph of Data Analysis by Year – Market and Competitive Analysis
#Market and Competitor Analysis #Graph #Market Analysis
-
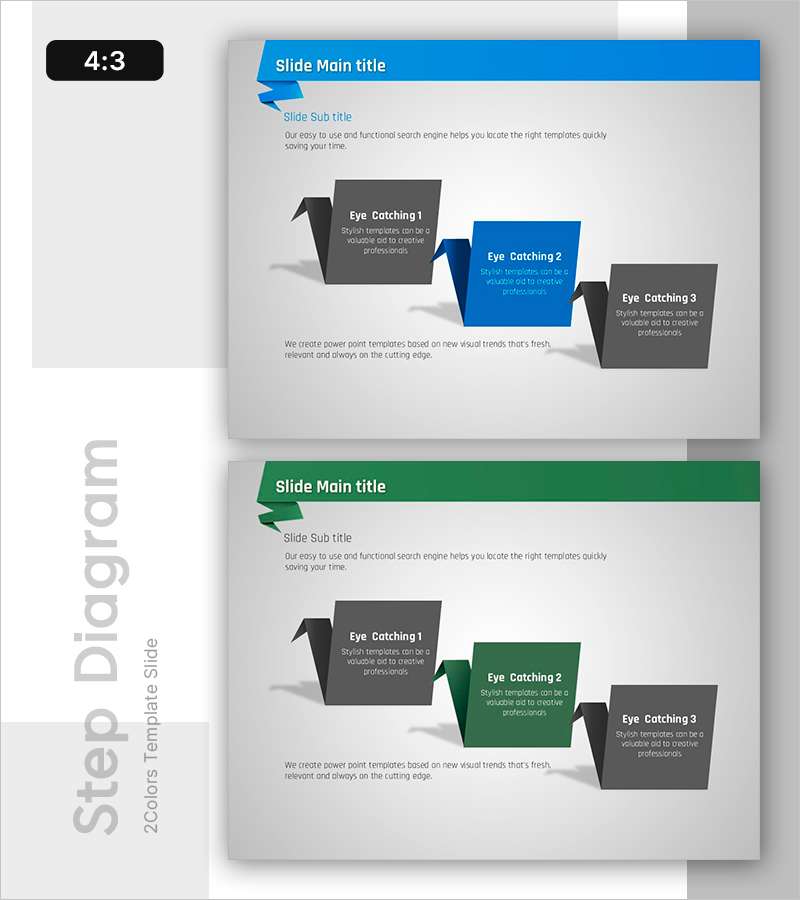
Paper Folding Concept Step Diagram – Business Strategy
#Business Promotion Strategy #Diagram #Phase-wise Schedule Plan
