Graph
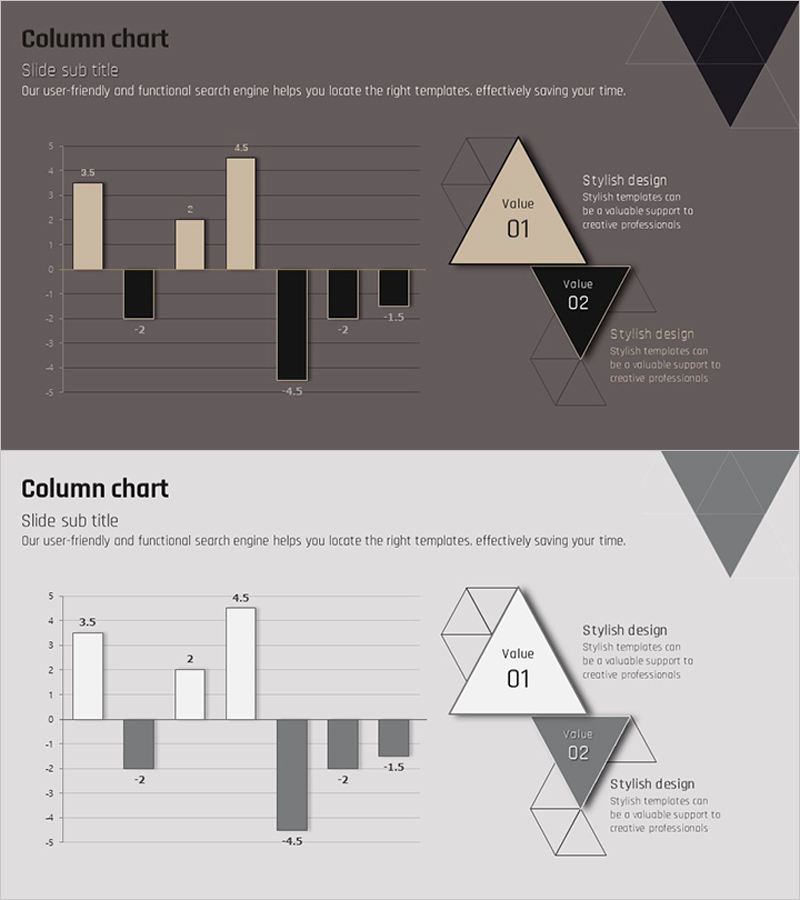
Rise and Fall Profit Chart – Decision Support through Data Visualization
RJ0300007_13
- Last Update 12/21/2025
- File Size 0.2MB
- # of Slides 2
- File Format PPTX
- Slide Ratio 16:9
- Color
About the Product
This slide utilizes a rise and fall profit chart to clearly visualize profit fluctuations. Its modern and stylish design makes it suitable for use in data analysis and business reports. The harmonious combination of gray and brown conveys stability and reliability, allowing you to convey profit insights quickly and intuitively across various business scenarios. The template is easy to edit, enabling simple updates with existing data.
Related Products
-
Graph of Changes in Real Estate Sales Due to Changes in Interest Rates
#Business Promotion Strategy #Market and Competitor Analysis #Graph
-
Plant Horizontal Bar Chart – Understand Market Trends
#Market and Competitor Analysis #Graph #Market Analysis
-
Comparative Analysis Graph of Work Progress Status – Visual Data Insights
#Product/Service #Business Introduction #Diagram
-
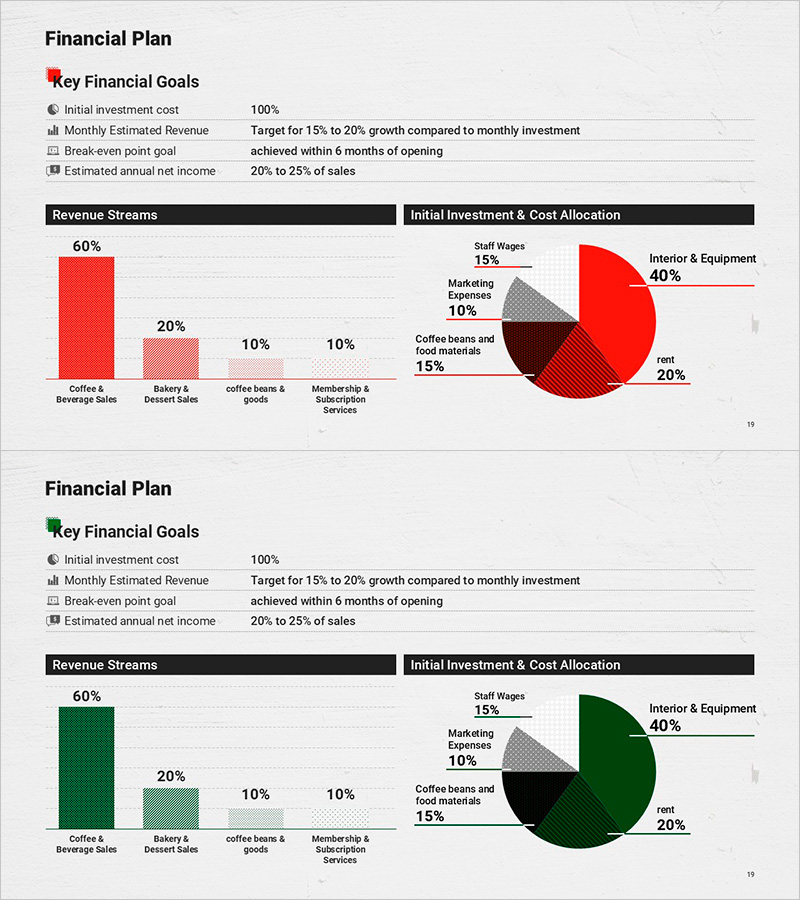
Cafe Business Initial Investment and Financial Strategy - Path to Success
#Financial Plans and Performance #Graph #Sales and Revenue
