Company Introduction
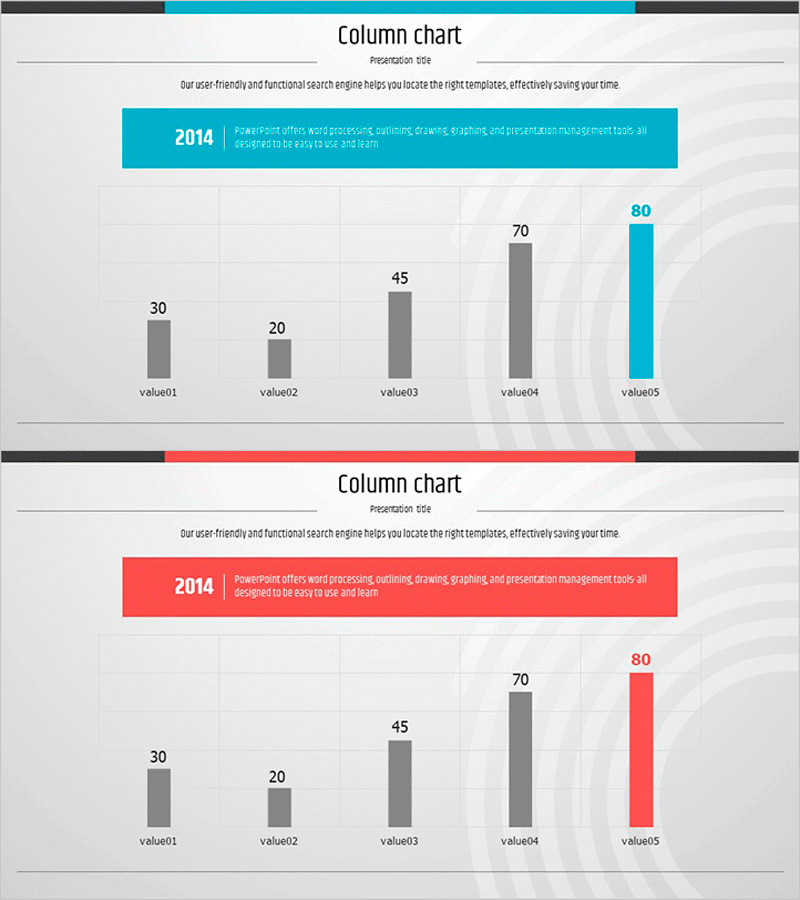
Visualizing Company Sales with Vertical Bar Chart – Sharing Trust and Success
RJ0200003_6
- Last Update 12/21/2025
- File Size 0.3MB
- # of Slides 2
- File Format PPTX
- Slide Ratio 16:9
- Color
Keywords
About the Product
This template provides an intuitive visual representation of company sales data through a vertical bar chart. The design combines modern elegance with a powerful impression by balancing red and blue colors. Built in a 16:9 ratio, the slide fits well into various presentations and offers clear and intuitive data comparisons. It's ideal for company introductions or business analysis scenarios, emphasizing a professional expression while delivering a strong message. The editing difficulty is rated 'easy', making it convenient to replace necessary data and text for immediate application to various materials.
Related Products
-
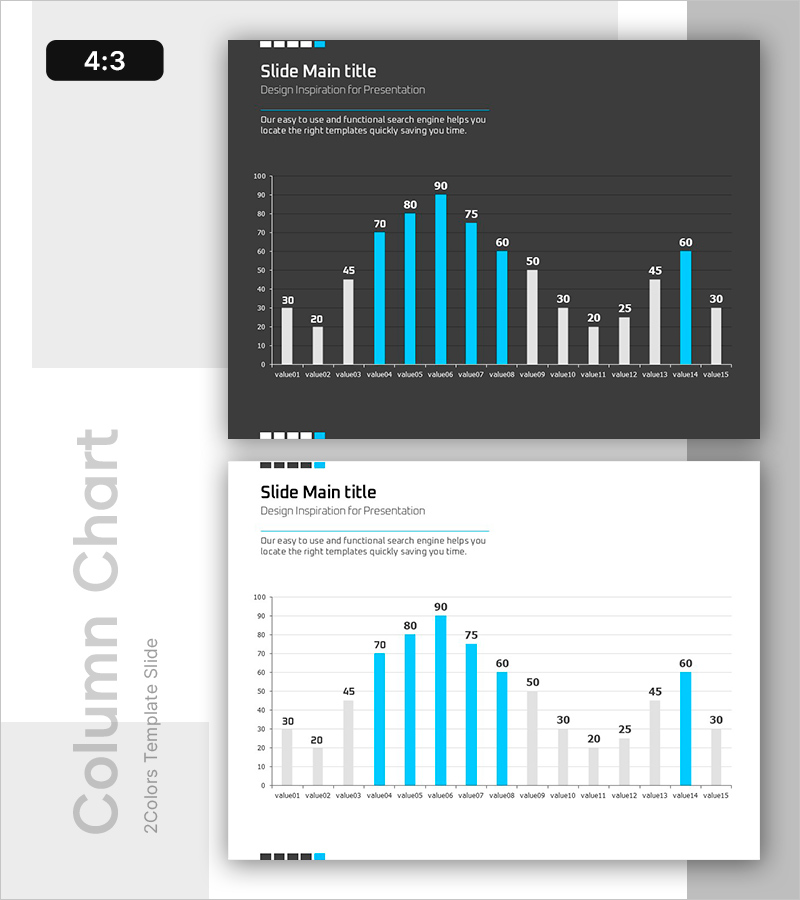
Visualization of Major Sales Growth Segments – Performance and Strategy
#Business Promotion Strategy #Financial Plans and Performance #Graph
-
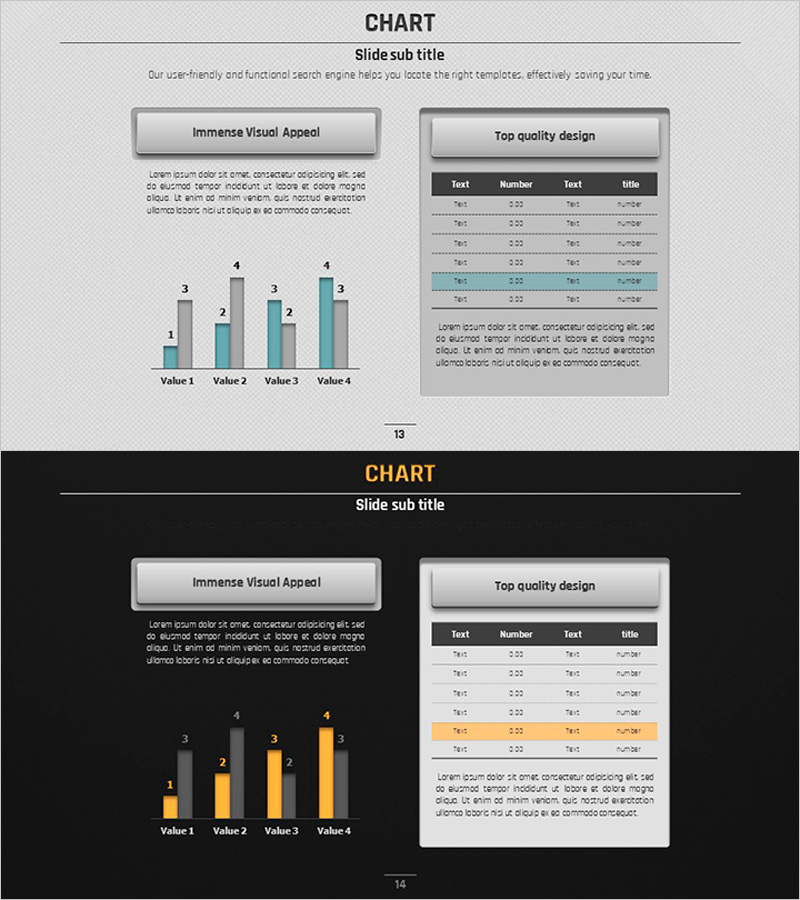
Volume Presentation Template with Tables and Clustered Charts – Efficient Data Analysis
#Market and Competitor Analysis #Financial Plans and Performance #Diagram
-
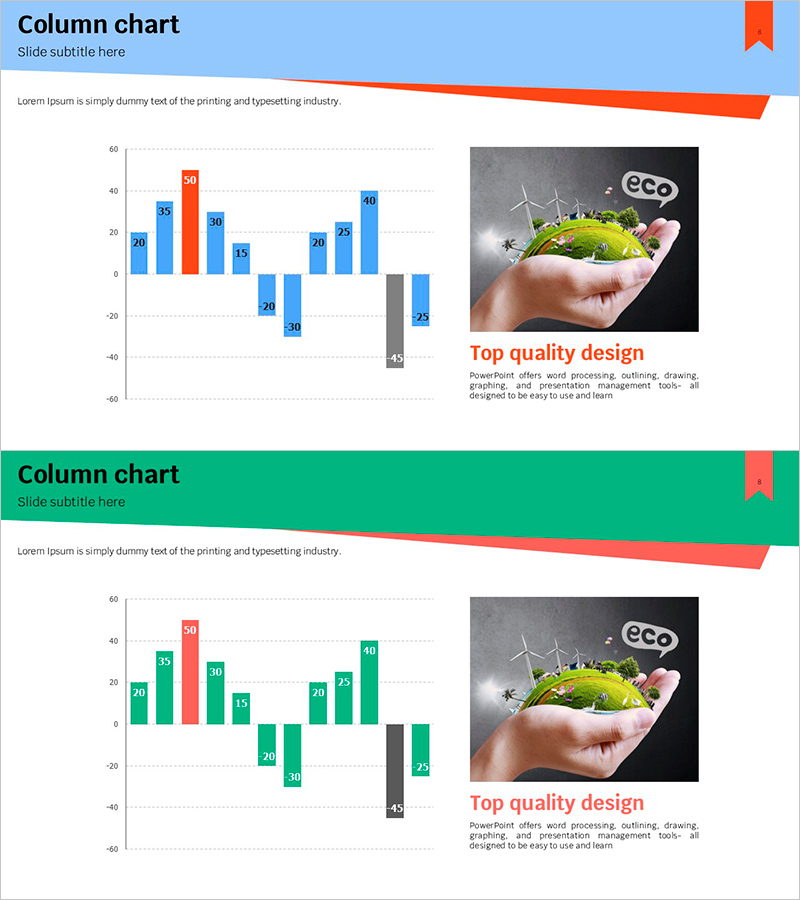
Renewable Energy Bar Graph – Performance and Strategy
#Business Promotion Strategy #Financial Plans and Performance #Graph
-
Mobile Business Overview – Vision and Strategy
#Business Introduction #Business Vision and Strategy #Diagram
