Financial Plans and Performance
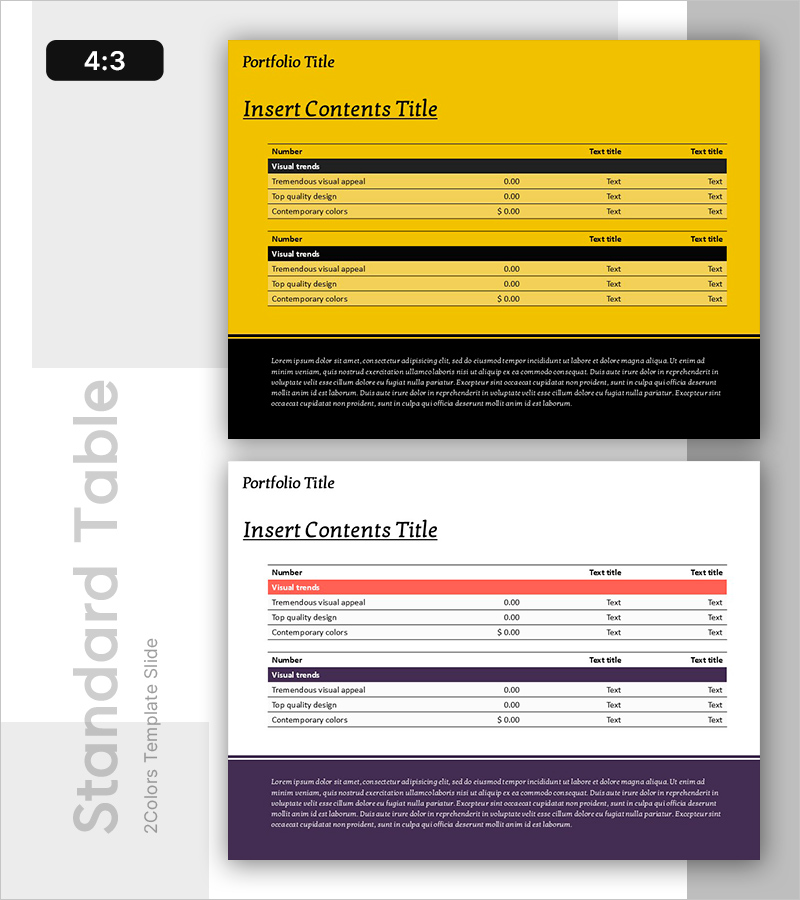
Data Analysis Table – Visualization of Financial Planning and Performance
RB0800076_8
- Last Update 12/21/2025
- File Size 0.2MB
- # of Slides 2
- File Format PPTX
- Slide Ratio 4:3
- Color
Keywords
About the Product
This slide features a data analysis table for clearly presenting financial planning and performance results. Its modern design utilizes contrasting colors for enhanced readability. The combination of yellow and red boosts attention, and engaging visual elements are attractively visualized. It is ideal for effective performance analysis, balance sheets, cash flow statements, and other content, instilling confidence with its presentation. The text and data fields are easy to replace with an overall editing difficulty rated as 'easy', allowing for quick application in various business documents.
Related Products
-
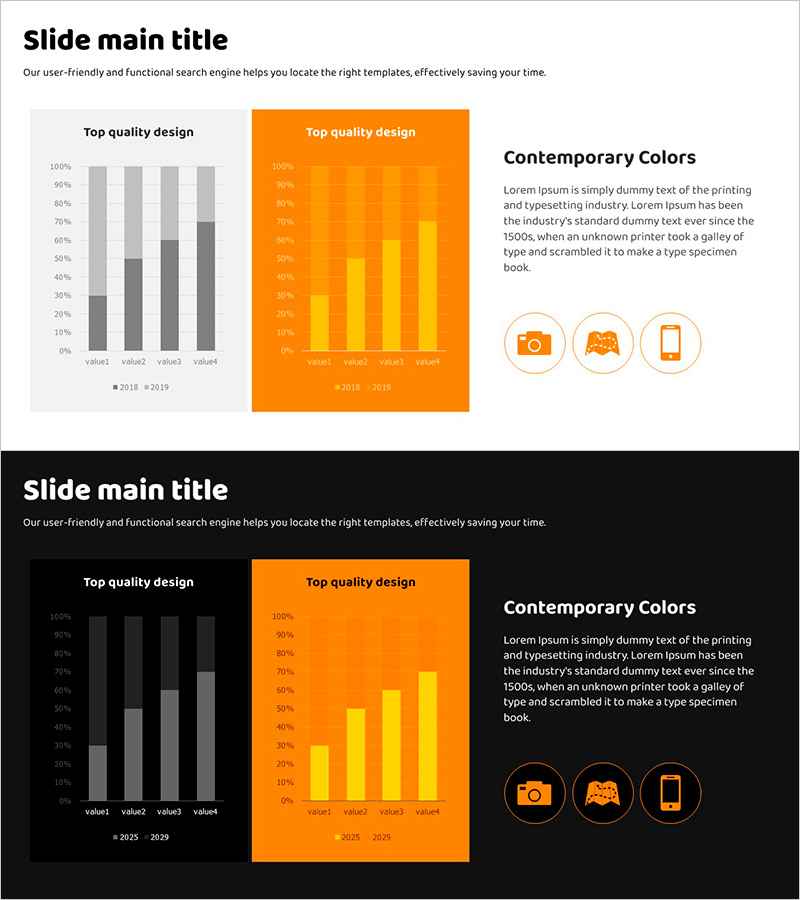
Orange Vertical Bar Chart for Market Growth Visualization – Competitive Advantage Analysis
#Market and Competitor Analysis #Diagram #Graph
-
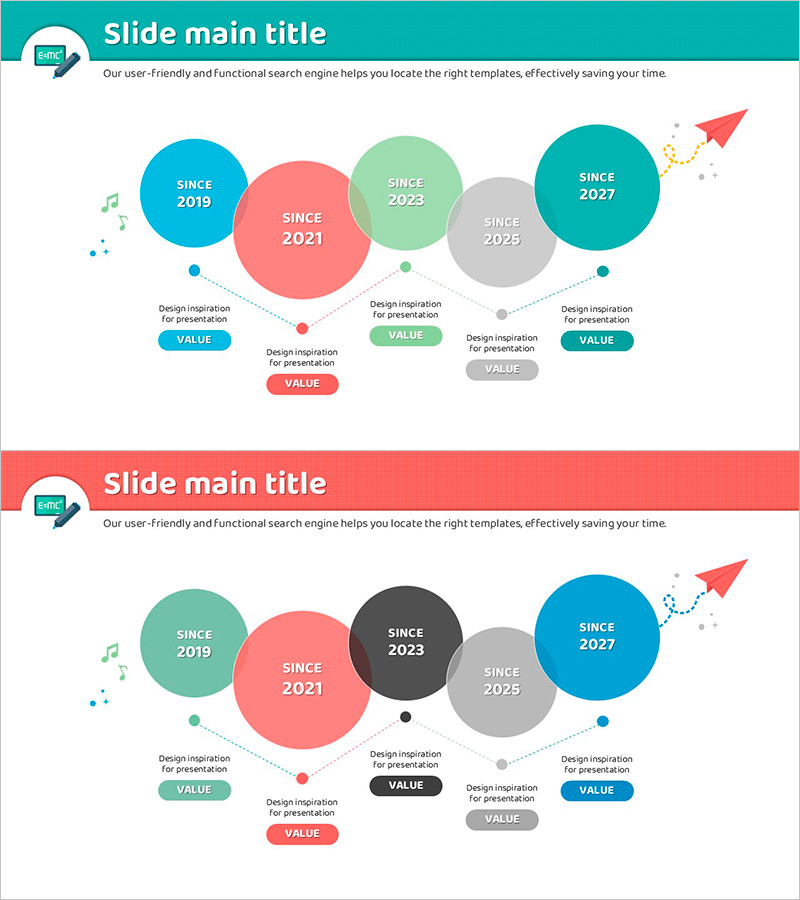
Flue Flow and Nesting Diagram – Visualization of Business Strategy Development
#Company Introduction #Business Promotion Strategy #Diagram
-
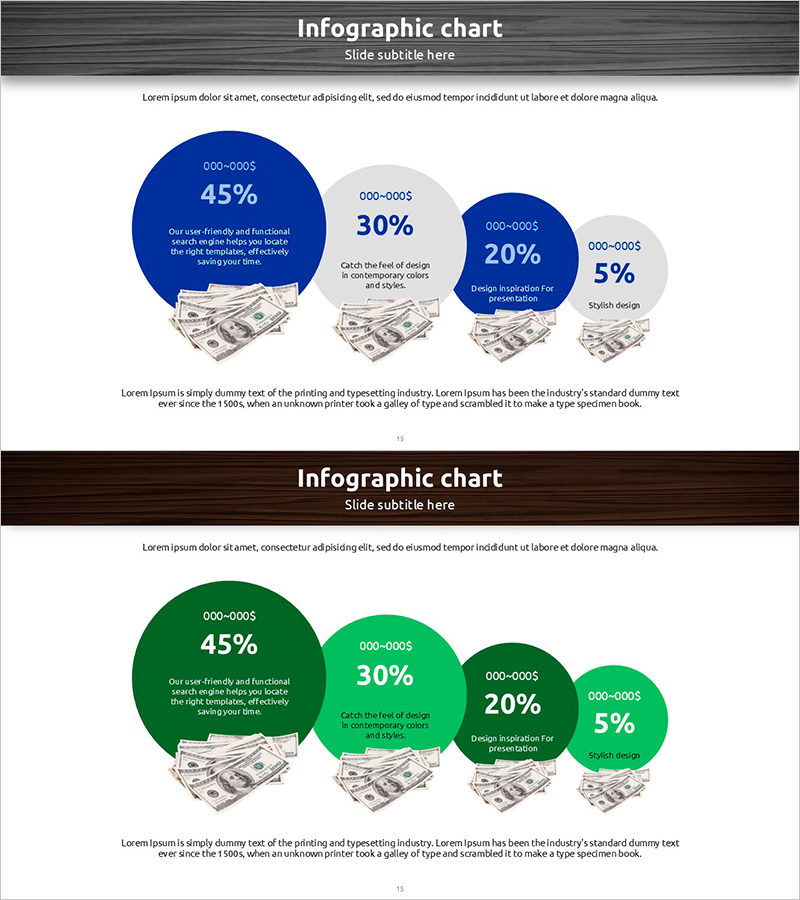
Principal Recovery Rate Diagram
#Operation Plan #Financial Plans and Performance #Diagram
-
Green Blue Multidirectional Diagram
#Technology Sector #Diagram #Service Establishment Approach
