Business Promotion Strategy
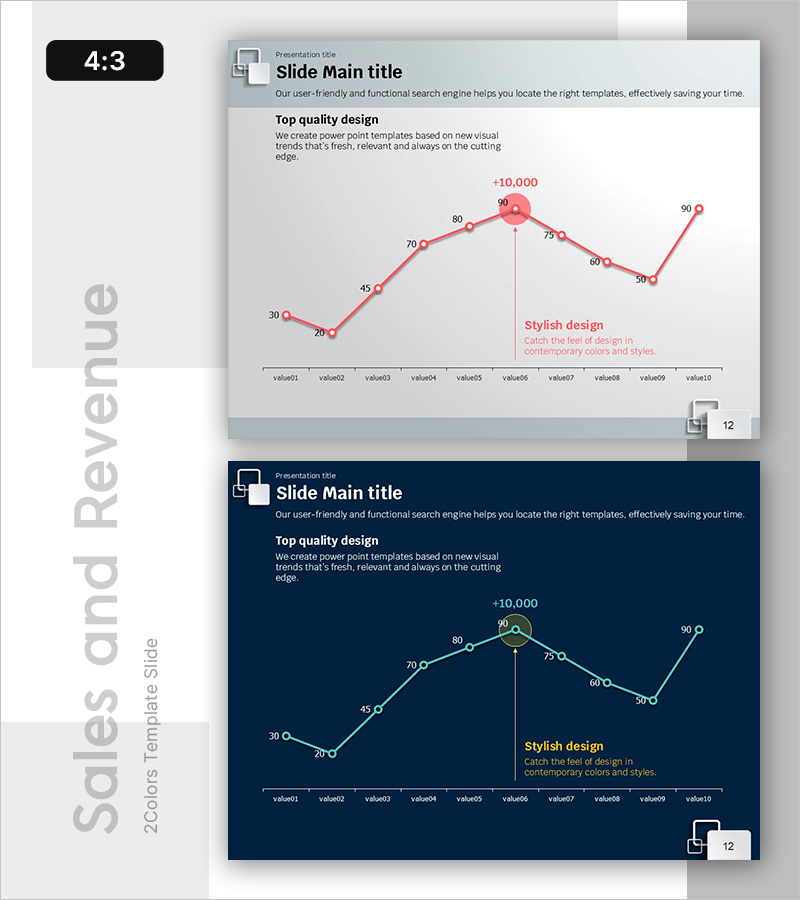
Highlighting Key Data Points in Trends – Performance and Vision
RB0800068_6
- Last Update 12/21/2025
- File Size 0.7MB
- # of Slides 2
- File Format PPTX
- Slide Ratio 4:3
- Color
Keywords
About the Product
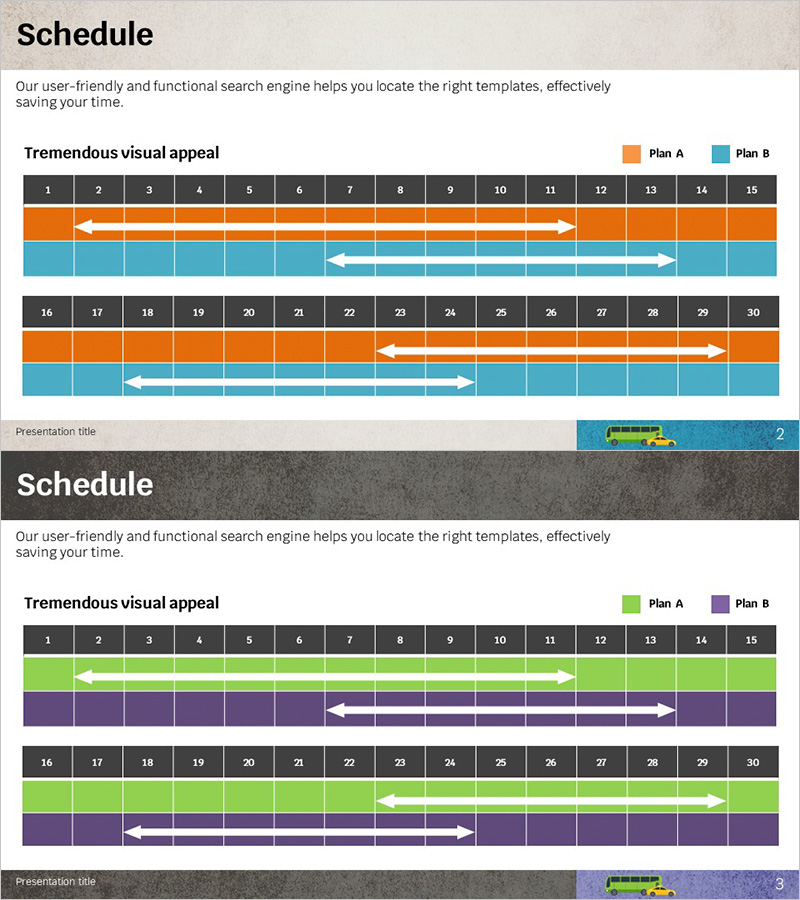
This slide is optimized to highlight key data points in trends, providing a clear representation of current status. The graph design offers intuitive and visually impactful presentations. The combination of red, teal, and yellow creates a dynamic visual appeal, making it effective for users in performance analysis or financial reviews. The editing difficulty is rated as 'easy', allowing for quick modifications of text and graph sections for various reports and proposals, ensuring wide applicability.
Related Products
-
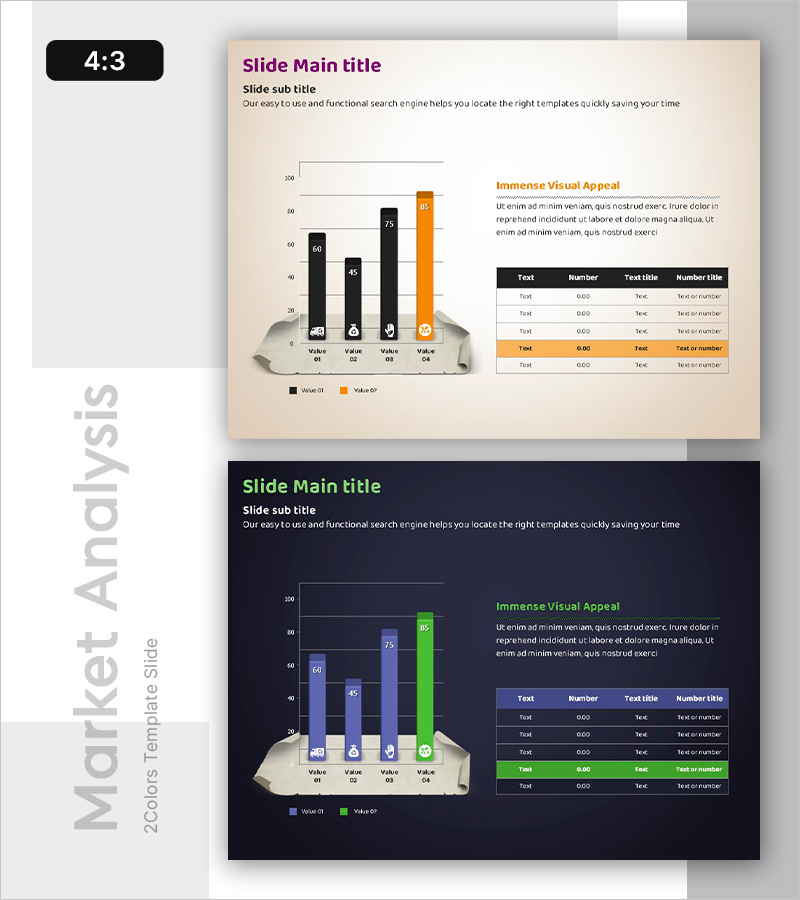
Comparative Analysis of Eco-Friendly Categories Slide – Market Competitive Advantage
#Market and Competitor Analysis #Financial Plans and Performance #Diagram
-
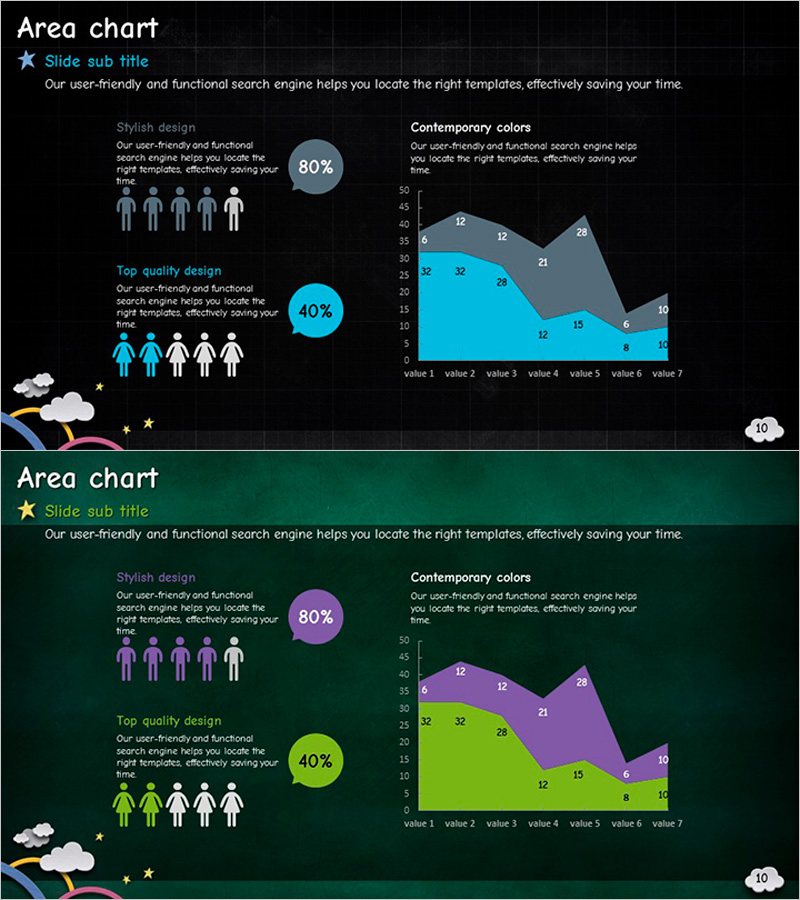
Customer Analysis Area Chart – Data Visualization for Market Understanding
#Market and Competitor Analysis #Graph #Other
-
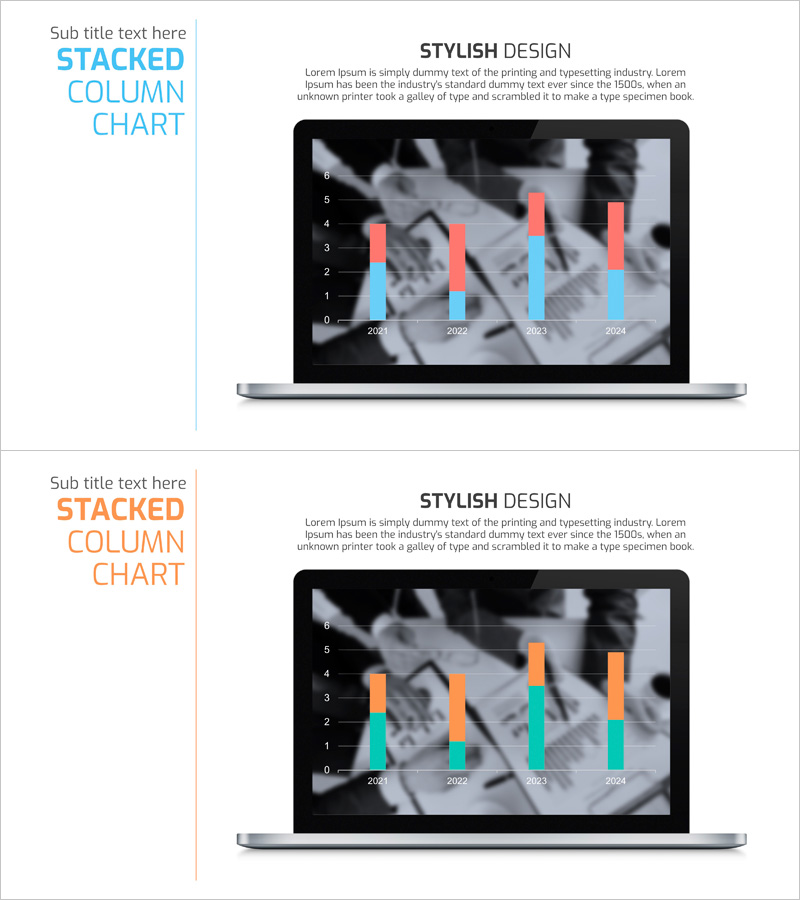
Visualizing Bar Graphs with PC Mockups – Competitive Market Analysis Tool
#Market and Competitor Analysis #Graph #Other
-
This Month's Schedule – Step-by-Step Summary
#Business Promotion Strategy #Diagram # Product Production Plan
