Marketing Plan and Strategy
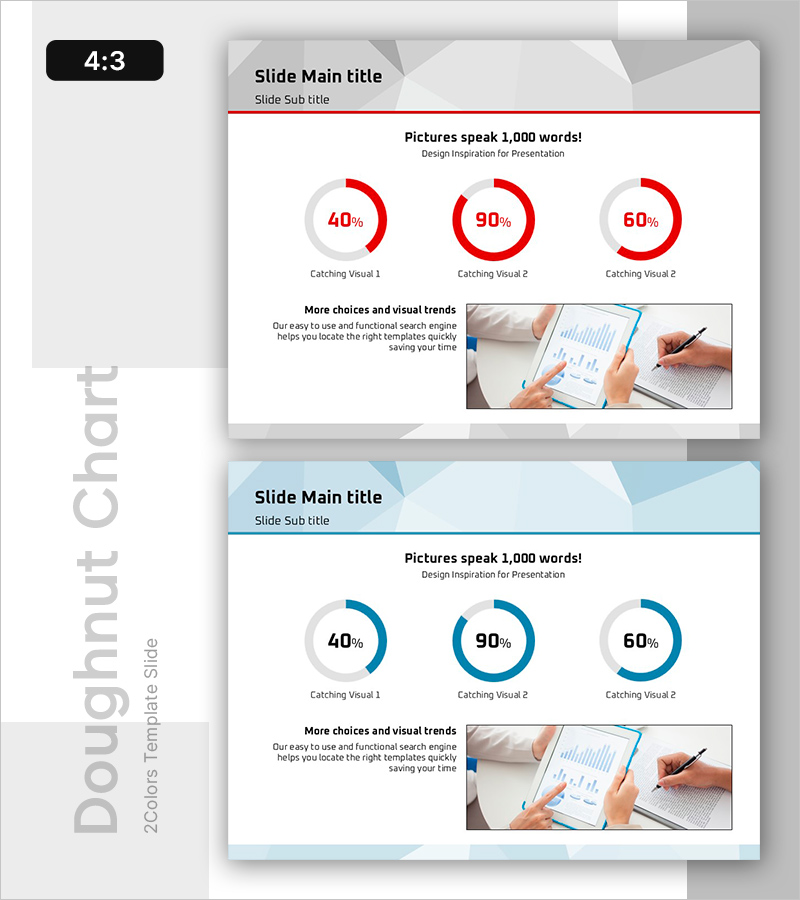
Sales and Promotion Impact on Financials – Data Visualization
RB0800027_8
- Last Update 12/21/2025
- File Size 3.7MB
- # of Slides 2
- File Format PPTX
- Slide Ratio 4:3
- Color
Keywords
About the Product
This single slide visualizes the impact of sales and promotions on financials using a donut chart. The bold red and blue color scheme captures attention and enhances clarity of data presentation. It provides deep insights into sales, promotion strategies, and financial performance, making it ideal for business strategy meetings or financial status presentations. It is a tool designed to maximize workforce outcomes effectively, with easy text and data replacement, classified as 'easy' in editing difficulty.
Related Products
-

Statistics on People's Physical Fitness in Bar Chart – Insights Aimed at Competitive Advantage
#Market and Competitor Analysis #Graph #Other
-
Analysis of Reading Volume by Data – Market Status and Competitive Advantage
#Market and Competitor Analysis #Diagram #Graph
-

Cluster Diagram for Setting Business Goals
#Business Vision and Strategy #Marketing Plan and Strategy #Diagram
-

Horizontal Bar Chart for Learning Method Survey Analysis – Strategic Approach
#Market and Competitor Analysis #Marketing Plan and Strategy #Graph
