Market and Competitor Analysis
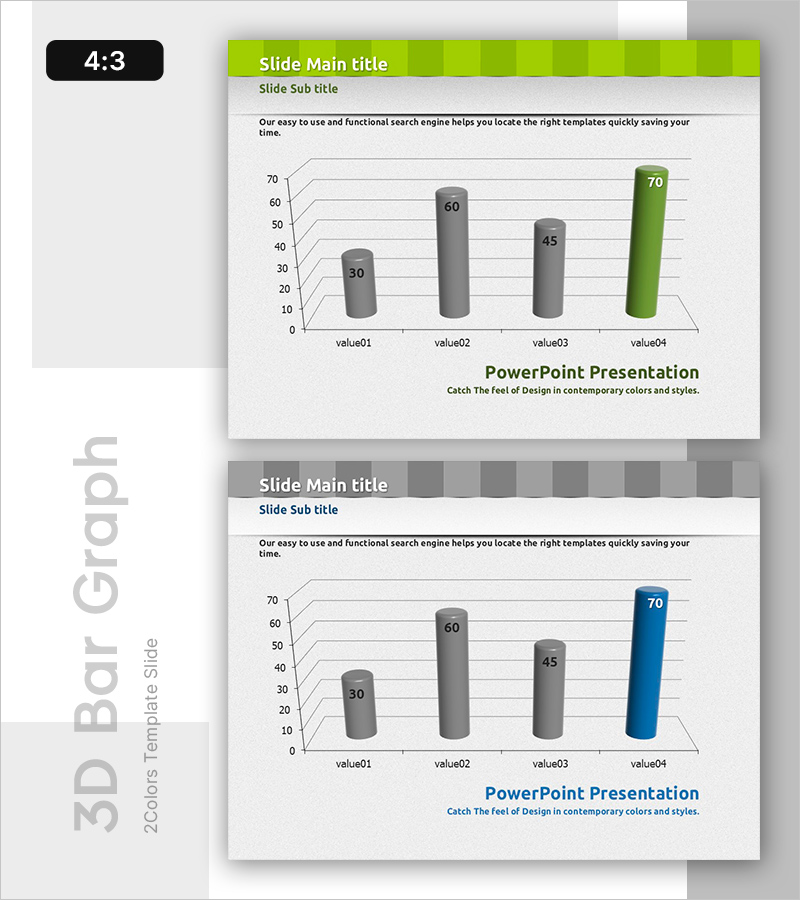
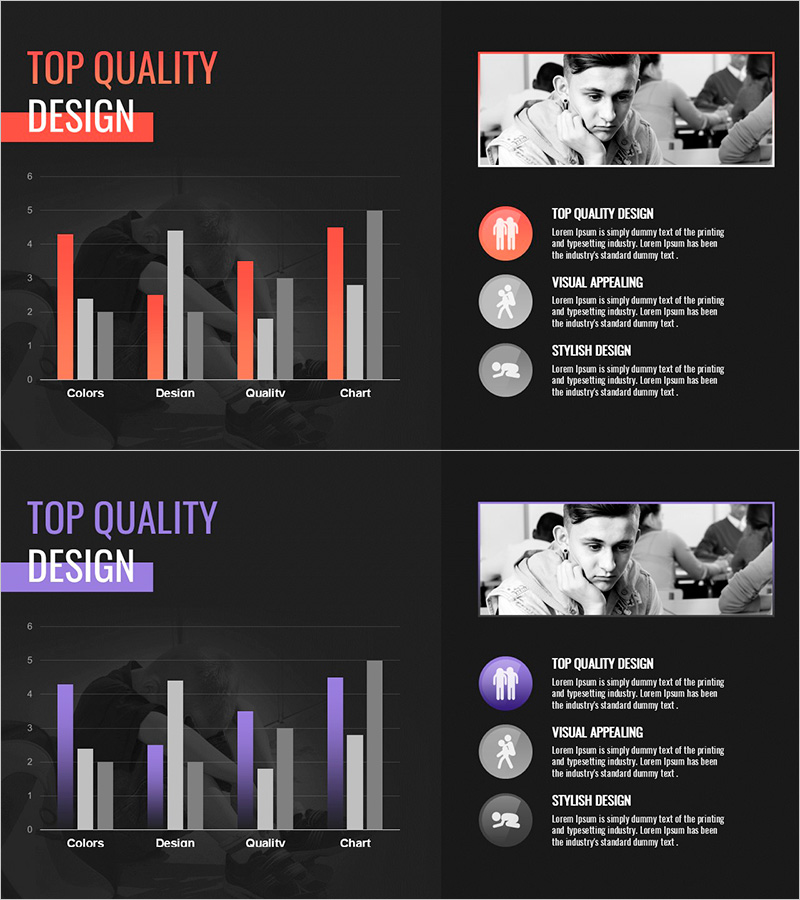
3D Bar Graph for Market Performance Analysis – Slide Highlighting Competitive Edge
RB0800017_7
- Last Update 12/21/2025
- File Size 1.7MB
- # of Slides 2
- File Format PPTX
- Slide Ratio 4:3
- Color
Keywords
About the Product
This slide effectively visualizes market performance using a 3D bar graph. Its sleek graphic elements and blue and green color tones emphasize competitive advantages, making it suitable for comparing vertical bars. Ideal for depicting market conditions and analyzing competitors, the data is conveyed intuitively to capture audience attention. Text and data replacement is straightforward, with an editing difficulty rated as moderate. This slide is perfect for business strategy reports and investment pitch presentations.
Related Products
-
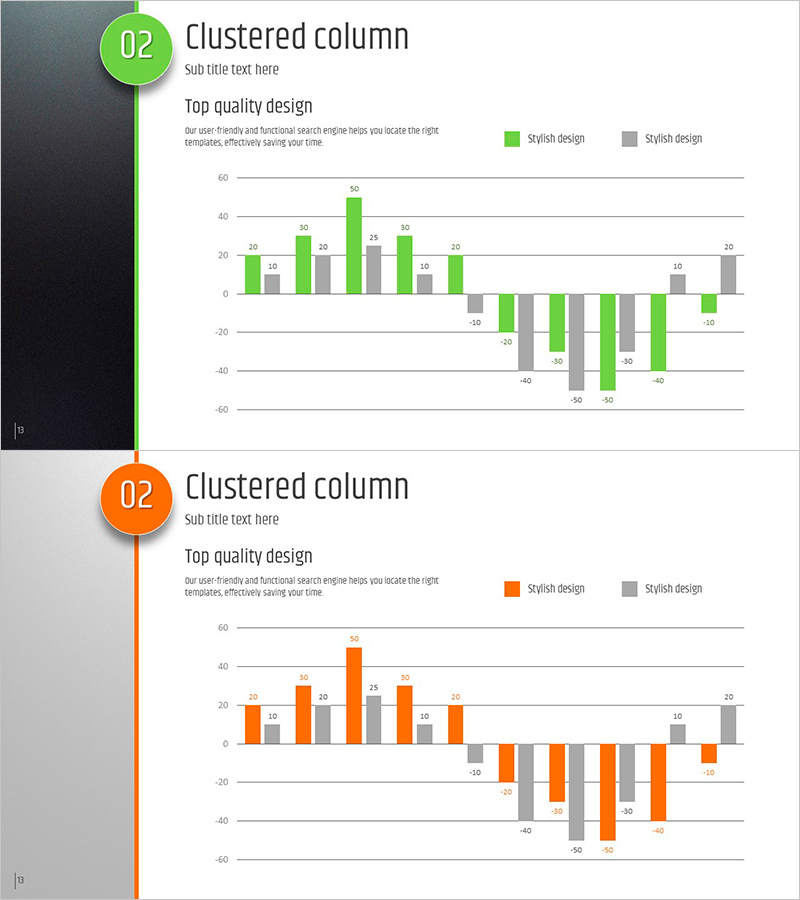
Five Color Powerpoint Template – Distinctive Graph Design
#Market and Competitor Analysis #Marketing Plan and Strategy #Graph
-
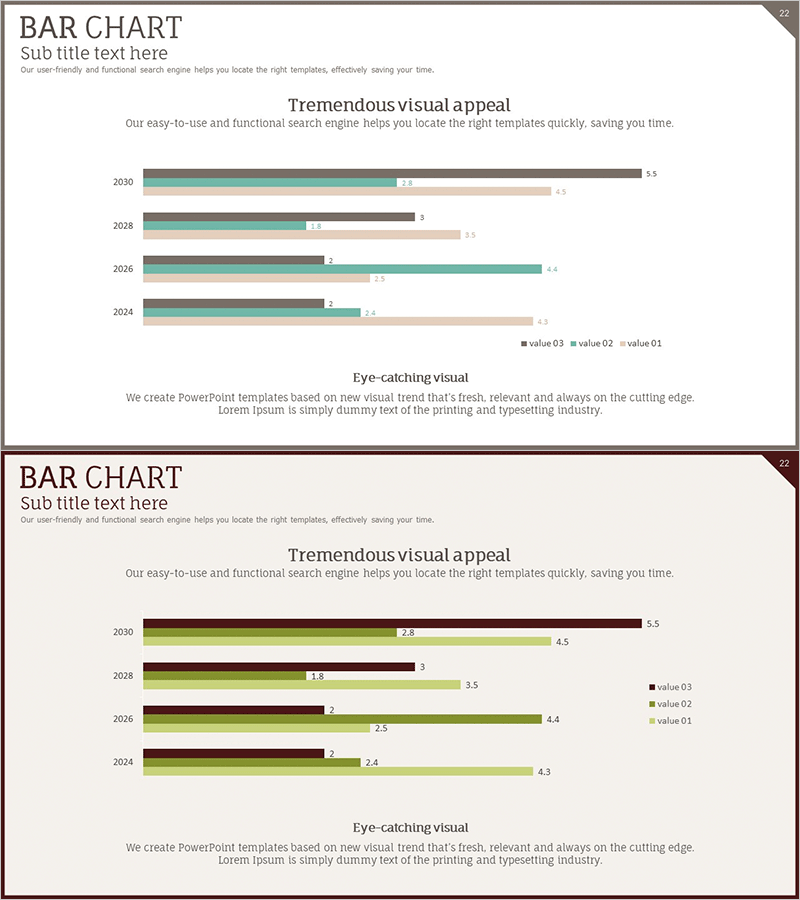
Market Analysis Bar Graph – The Essence of Data Visualization
#Graph
-
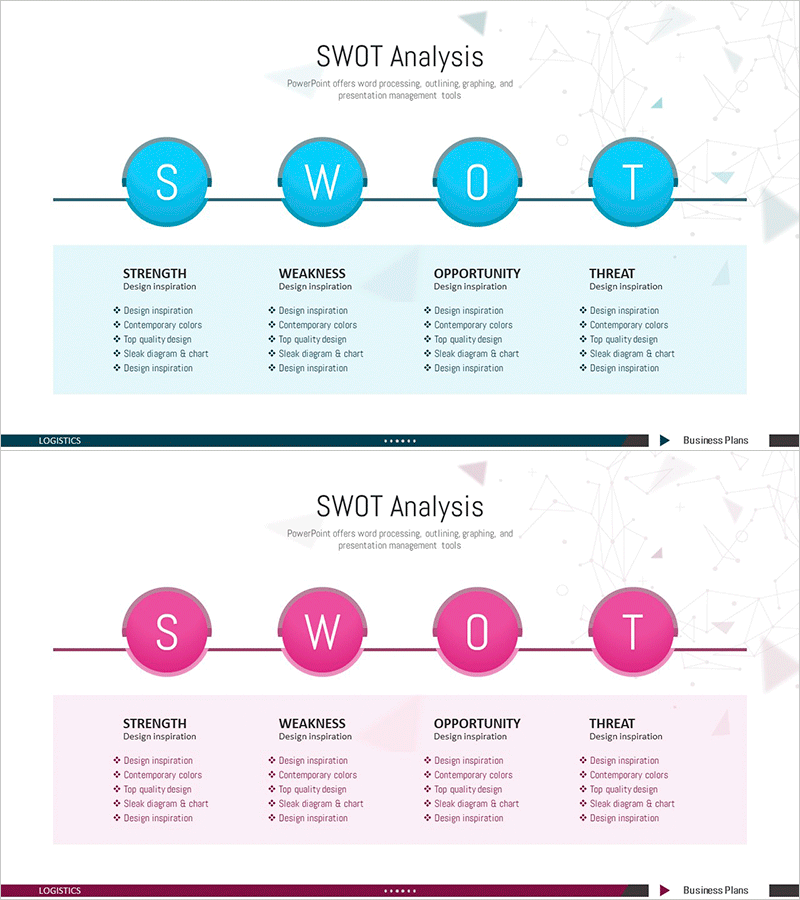
SWOT Analysis Slide – Optimal Design for Market and Competitive Analysis
#Market and Competitor Analysis #Diagram #SWOT Analysis
-
Surveys on Crisis and Help – Intuitive Data Visualization
#Market and Competitor Analysis #Graph #Customer Analysis
