Business Promotion Strategy
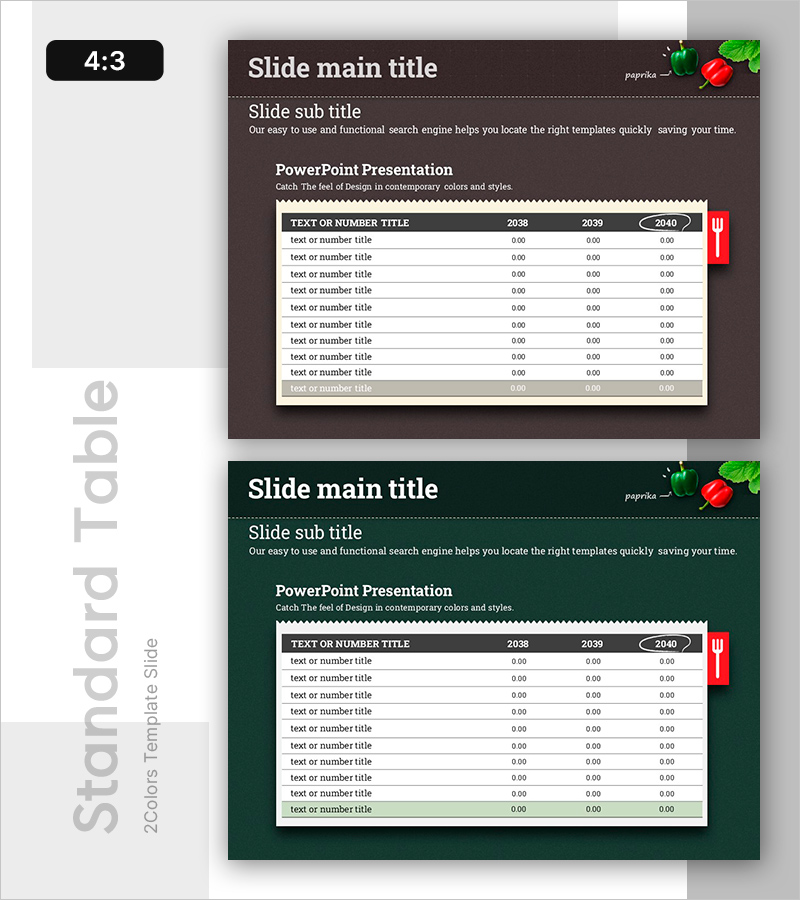
Comparison Table of Food Categories and Core Ingredients – Emphasizing Key Financial Indicators
RB0700013-1_6
- Last Update 12/21/2025
- File Size 2.1MB
- # of Slides 2
- File Format PPTX
- Slide Ratio 4:3
- Color
Keywords
About the Product
This slide features a comparison table of core ingredients for different food categories, intuitively supporting data analysis. The warm brown and green colors create a comfortable and trustworthy atmosphere, while the layout is simple and ensures a smooth flow of information. It is particularly useful for business strategies and financial performance analysis, making it effective for various food-related presentations. Text and number sections are easily editable, with an overall editing difficulty rated as 'easy', ensuring anyone can utilize it quickly.
Related Products
-
Service Operation Plan – Detail of Business Strategy and Technology Sector
#Business Vision and Strategy #Technology Sector #Diagram
-
Honeycomb Interior Diagram – Product Introduction & Service Composition
#Product/Service #Diagram #Composition
-

Gradient One Theme Development Status Graph
#Product/Service #Diagram #Graph
-
Medical Business Area Diagram – Business Introduction and Analysis
#Company Introduction #Business Introduction #Diagram
