Market and Competitor Analysis
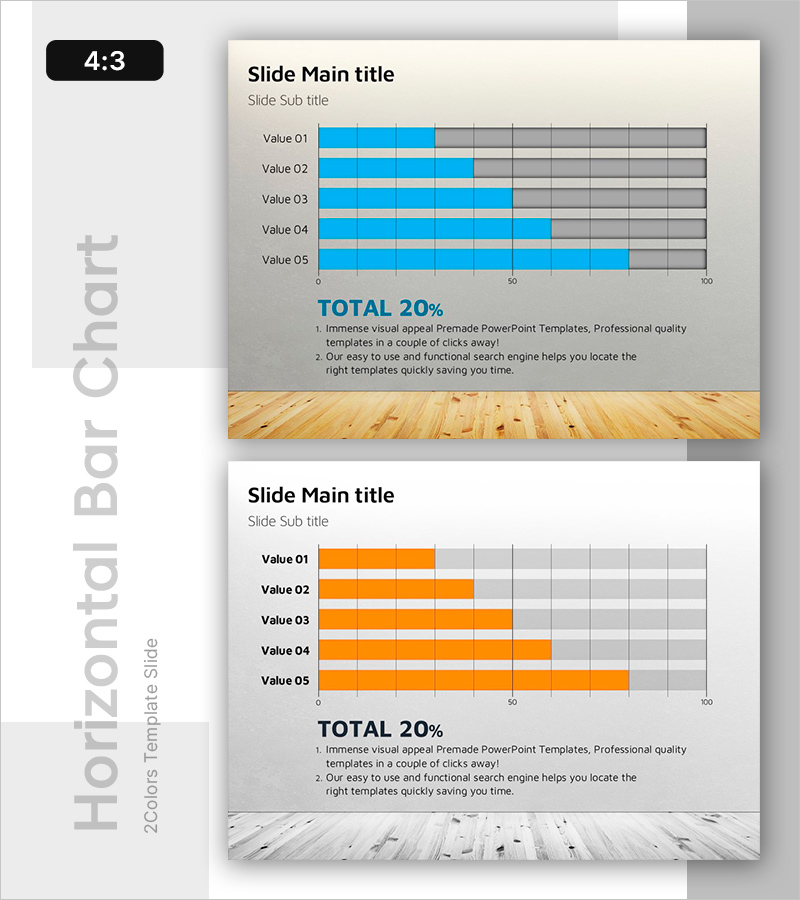
Visual Summary of Key Indicators – Leveraging Graphs for Market Analysis
RB0600003_4
- Last Update 12/21/2025
- File Size 1.7MB
- # of Slides 2
- File Format PPTX
- Slide Ratio 4:3
- Color
Keywords
About the Product
This slide presents a horizontal bar graph that visually summarizes key indicators. With a minimalistic design, it emphasizes clear data comparison, captivating attention through the harmony of blue and orange. The top features a relevant title, providing a visual impact to all presenters. This slide is ideal for conducting market and competitor analysis, where summarizing and comparing data is crucial. Users can easily replace data, with editing difficulty rated as easy.
Related Products
-
Orange Illustration Chart - Engaging Design and Functional Use
#Graph
-
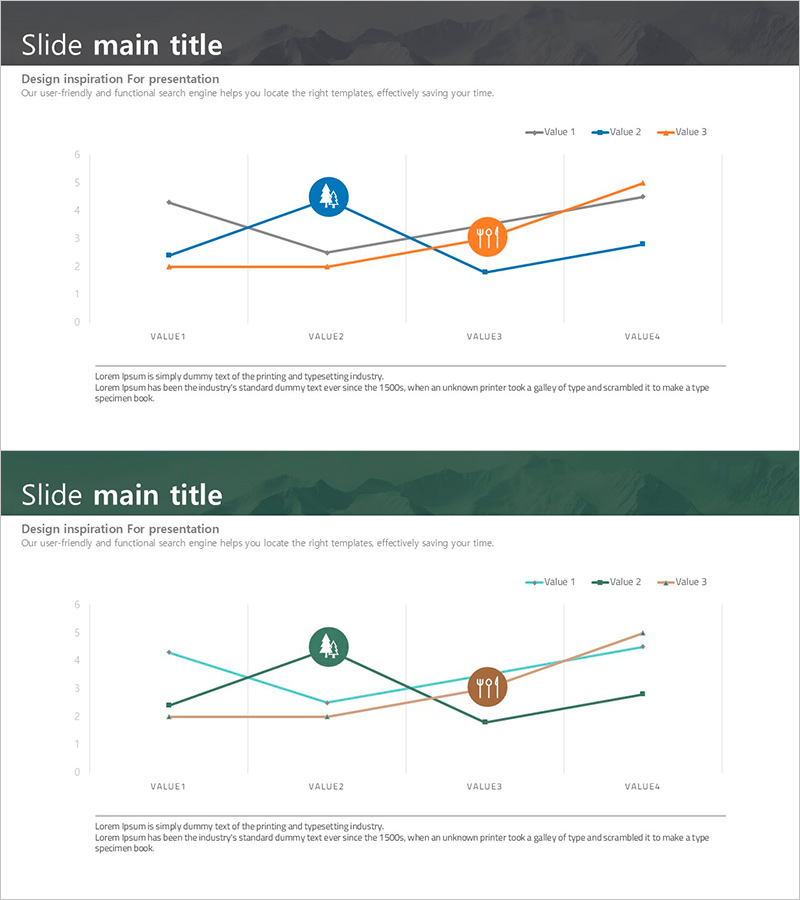
Three-Color Line Chart - Visualizing Competitive Advantage
#Market and Competitor Analysis #Graph #Competitive Advantage
-

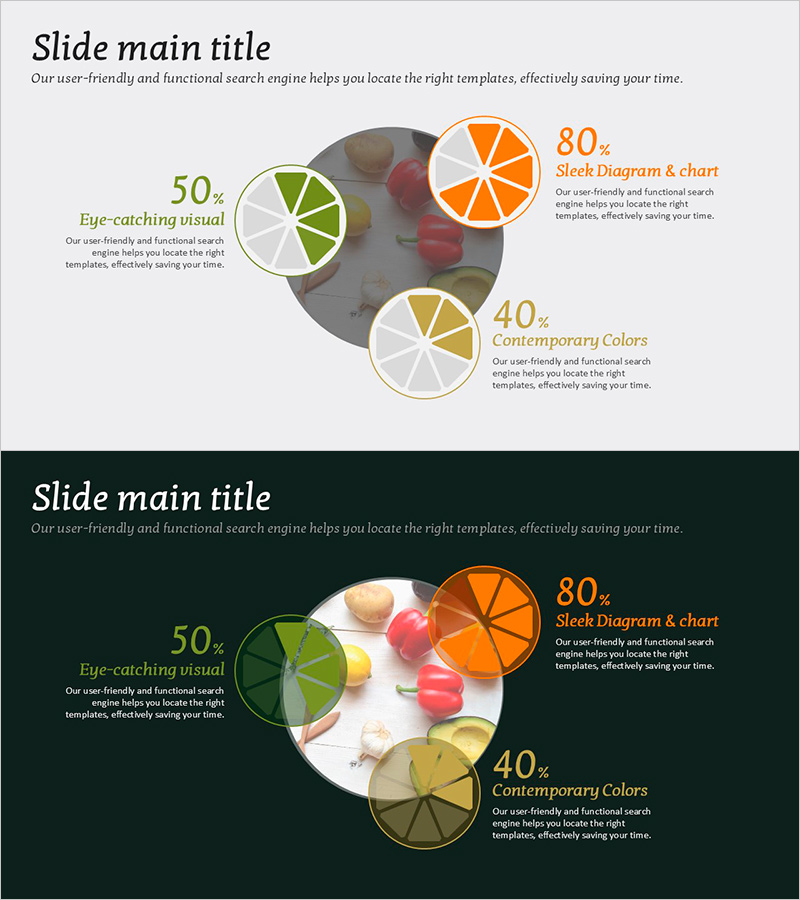
Simple Donut Chart – Data Visualization with Sleek Design
#Graph
-

Introduction to Types of Groom-to-Be Tuxedos
#Product/Service #Market and Competitor Analysis #Product/Service Introduction
