Market and Competitor Analysis
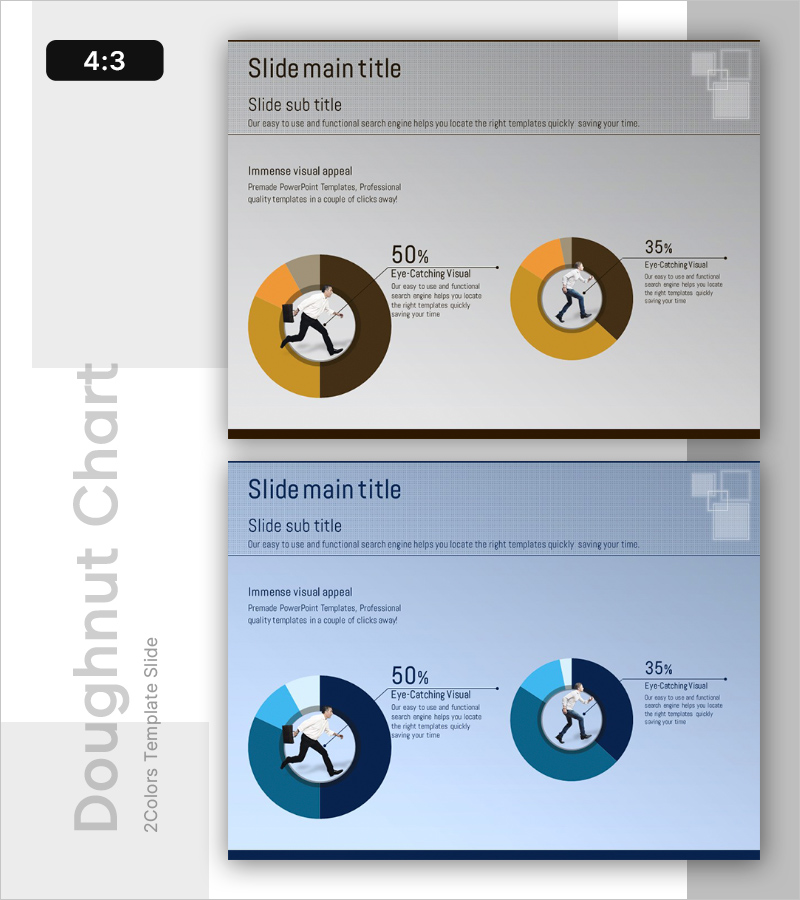
Causes of Stress for Office Workers – Visualized Donut Chart
RB0100048_5
- Last Update 12/21/2025
- File Size 0.7MB
- # of Slides 2
- File Format PPTX
- Slide Ratio 4:3
- Color
Keywords
About the Product
This slide presents the causes of stress for office workers utilizing a donut chart for visual representation. The contrast of orange and blue adds visual interest while ensuring a clear and structured data layout. It is particularly useful in customer analysis and market share reports, offering insights through clear data comparison. The slide allows easy replacements of text and data elements, making the editing difficulty rated as 'easy'.
Related Products
-
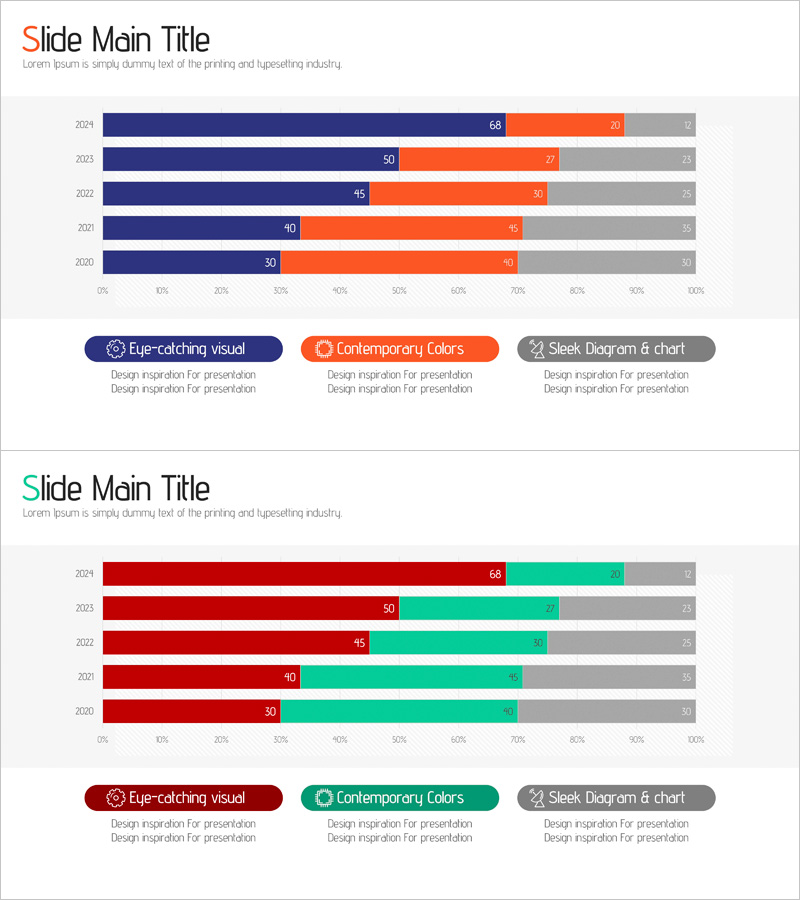
Data Analysis Segmented Bar Graph – Technology Status and Analysis
#Product/Service #Business Introduction #Graph
-
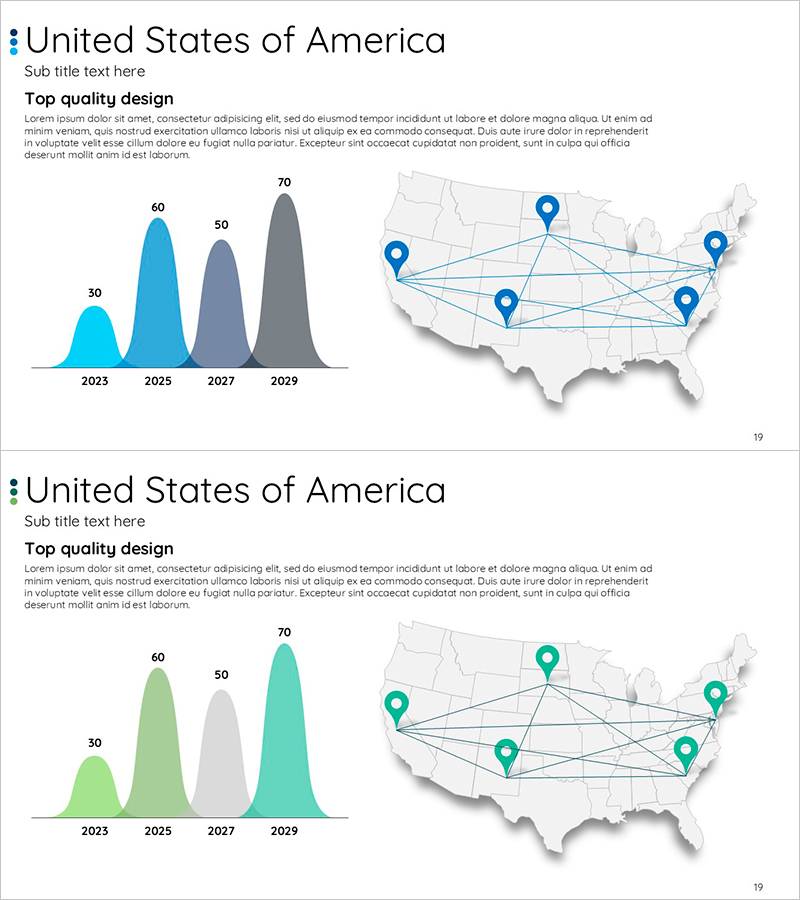
Graph of Analysis by Year in the Americas – Infrastructure and Business Strategy
#Company Introduction #Business Introduction #Graph
-

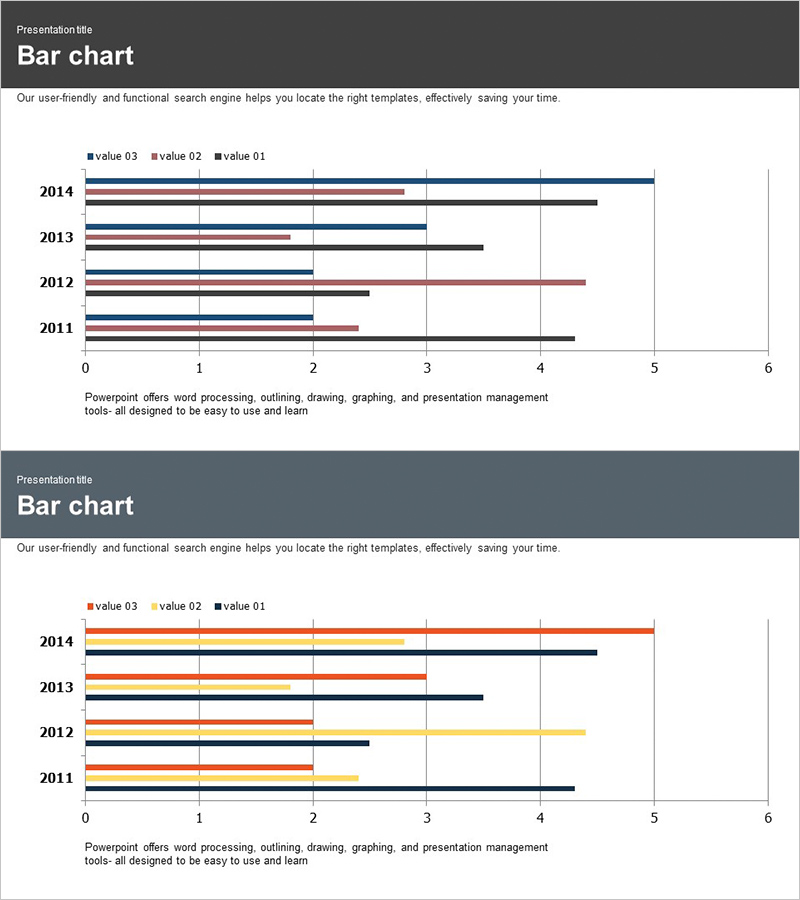
Comparison Graph by Transportation Industry – Market Analysis and Financial Performance
#Market and Competitor Analysis #Financial Plans and Performance #Graph
-
Market Analysis Graph by Year – Visualizing Competitive Advantage
#Market and Competitor Analysis #Graph #Market Analysis
