Business Promotion Strategy
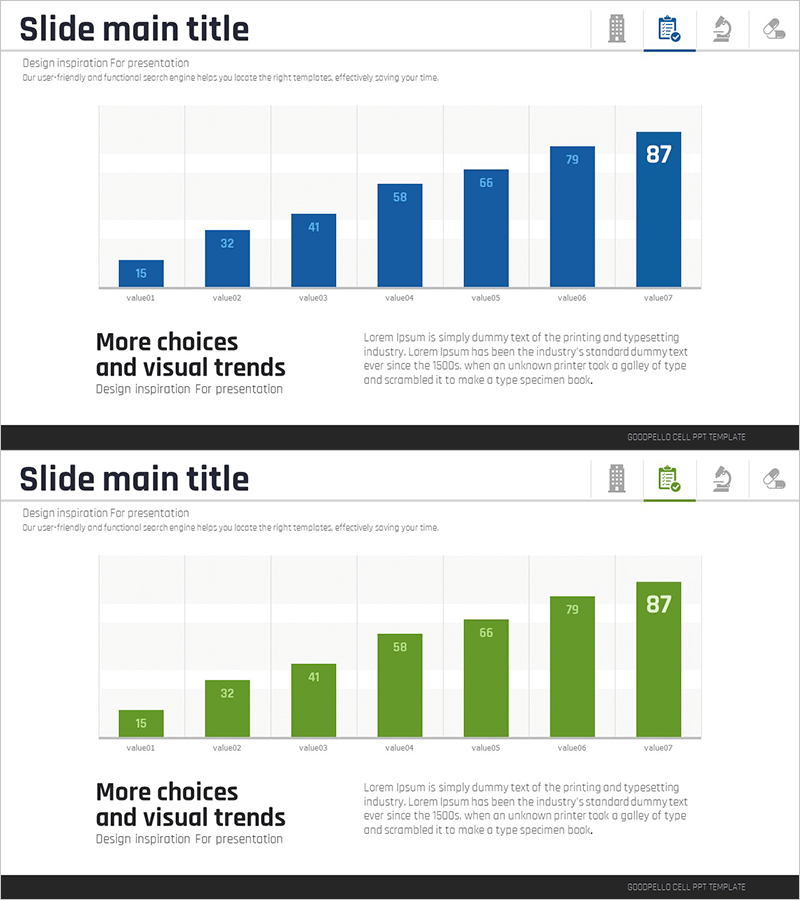
Target Performance and Expected Results – Visualized with Vertical Bar Charts
RB0100041_5
- Last Update 12/21/2025
- File Size 0.9MB
- # of Slides 2
- File Format PPTX
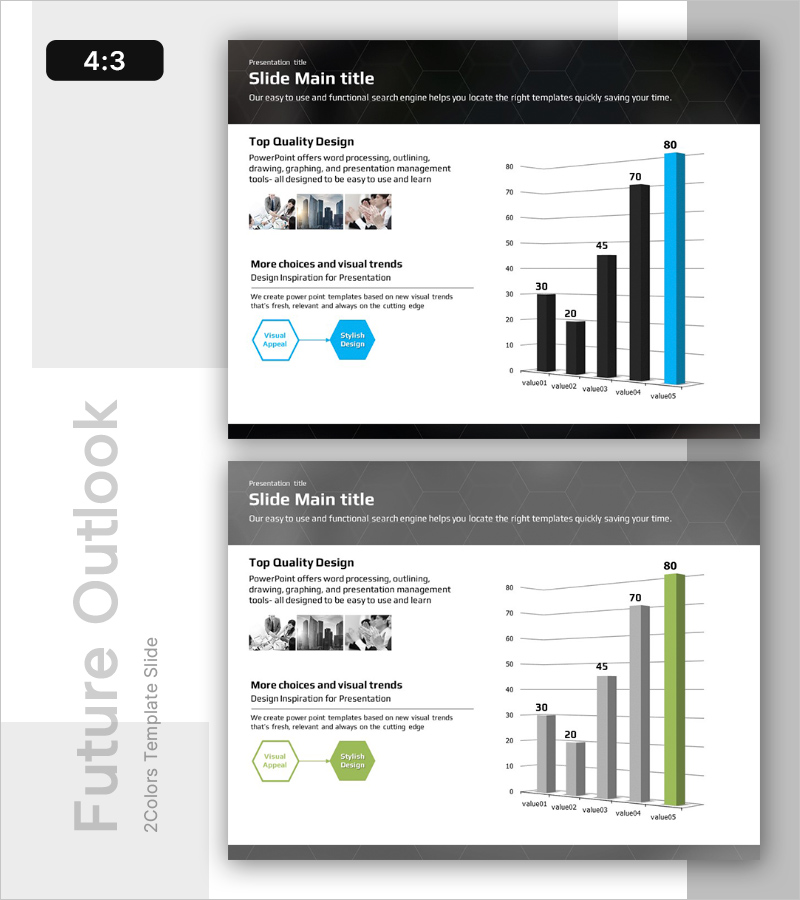
- Slide Ratio 4:3
- Color
Keywords
About the Product
This slide includes both vertical bar charts visualizing target performance and expected results. The harmonious blend of black, blue, and green allows for clear information delivery and an intuitive data comparison structure. It is suitable for business performance analysis or profit forecasts, designed for easy and quick edits. This platform provides various text and image swapping options for immediate application by professionals.
Related Products
-
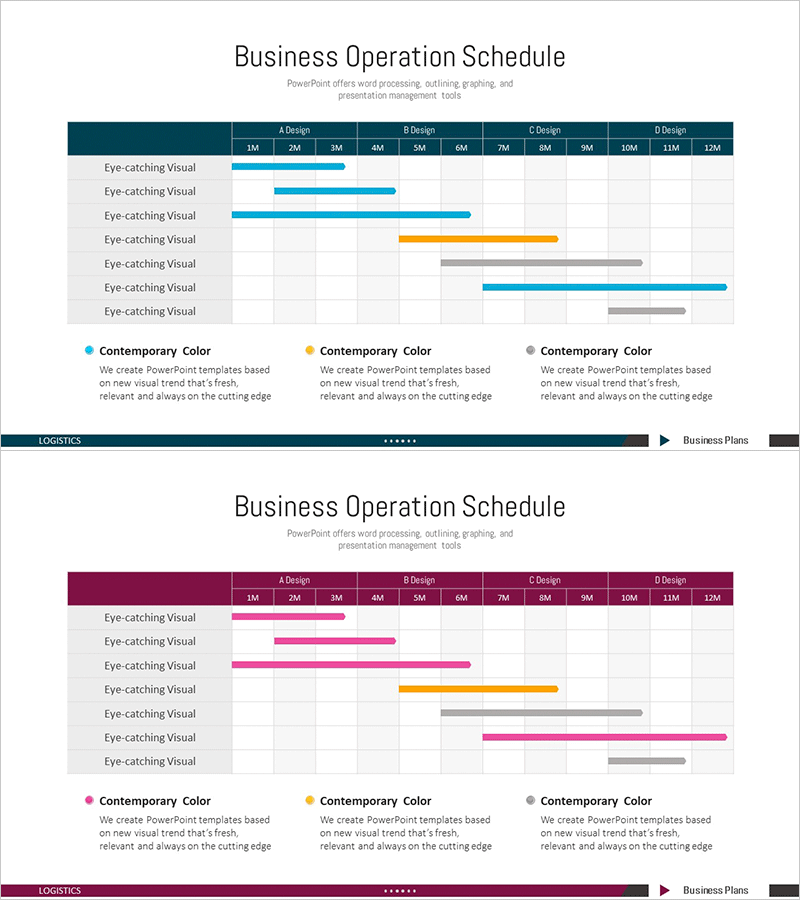
Business Promotion Calendar – Effective Business Operation Plan
#Business Promotion Strategy #Operation Plan #Diagram
-
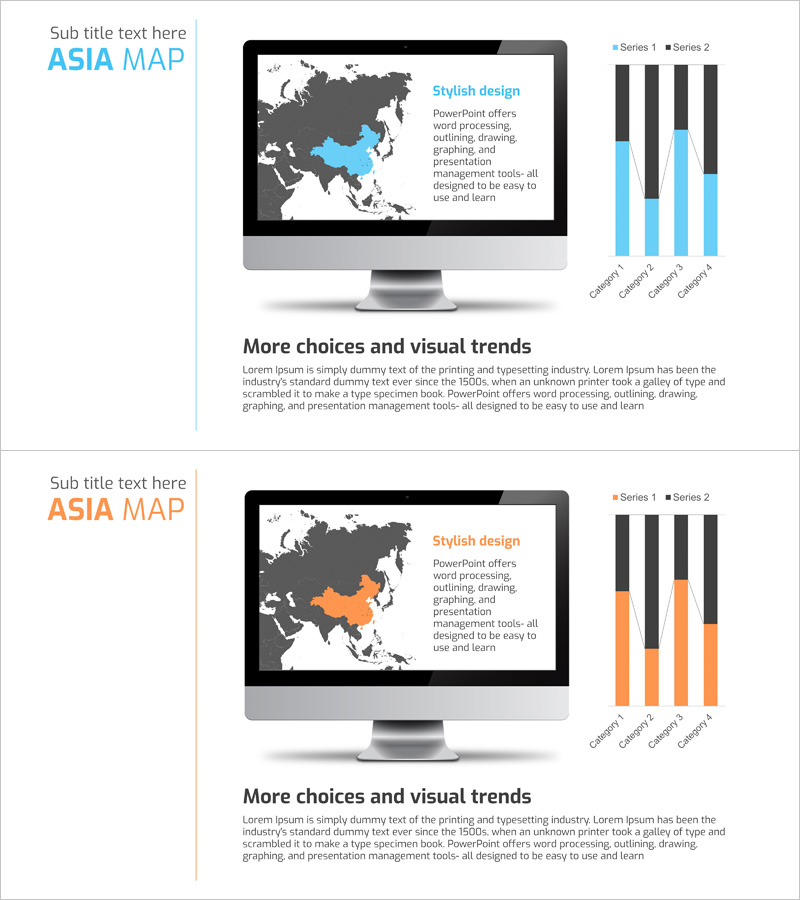
Asia Target Market Analysis Graph – Visualizing Market Strategy
#Market and Competitor Analysis #Marketing Plan and Strategy #Graph
-
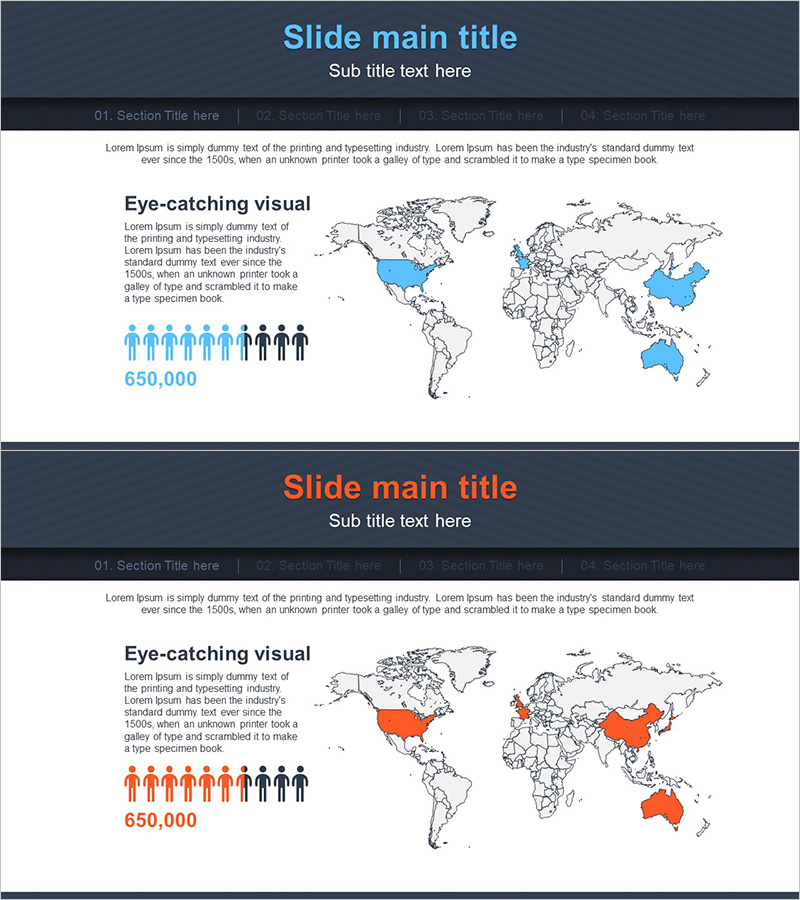
Global User Status Analysis Graph – Data Visualization
#Market and Competitor Analysis #Graph #Other
-
Future Outlook Vertical Bar Graph – Market Analysis
#Market and Competitor Analysis #Graph #Future Outlook
