
Market and Competitor Analysis
Case Study Slides Using Diagrams and Charts
RM0900004_6
- Last Update 12/21/2025
- File Size 27.7MB
- # of Slides 2
- File Format PPTX
- Slide Ratio 16:9
- Color
Keywords
About the Product
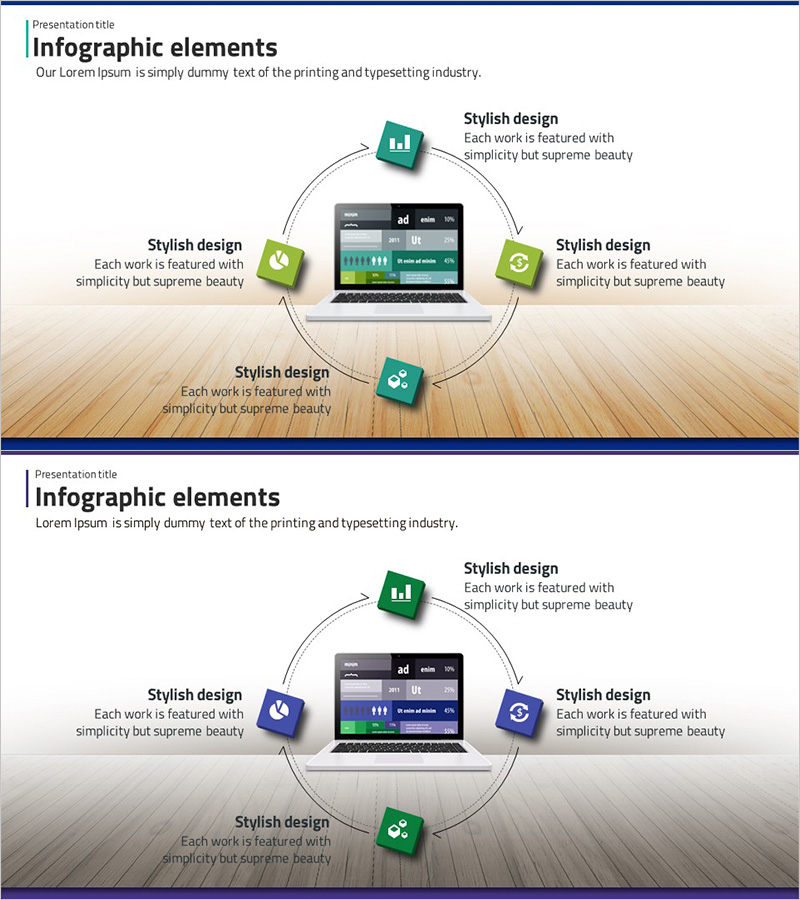
This slide utilizes modern diagrams and charts to intuitively present case studies. The left bar chart clearly represents survey results, while the central image and right pie chart emphasize the flow of information. It is optimized for presentations requiring clarity in business analysis with diverse data visualizations.
Related Products
-
App Payment Service Operation Plan Diagram
#Operation Plan #Technology Sector #Diagram
-
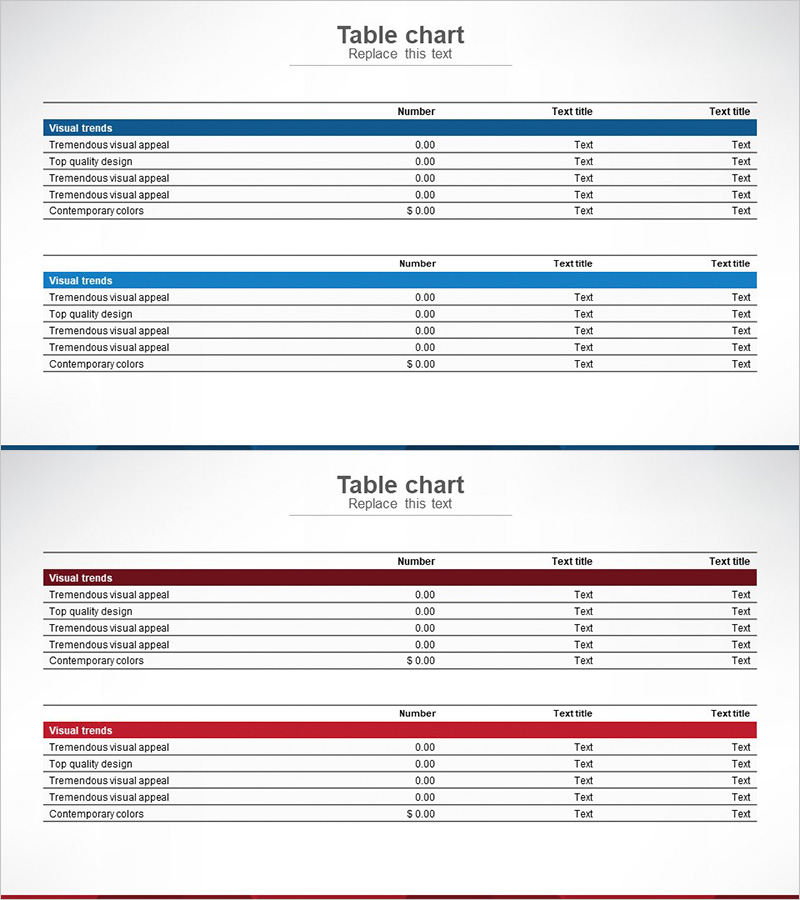
Sales and Profit Table – Clear Visualization of Financial Planning
#Financial Plans and Performance #Diagram #Other
-
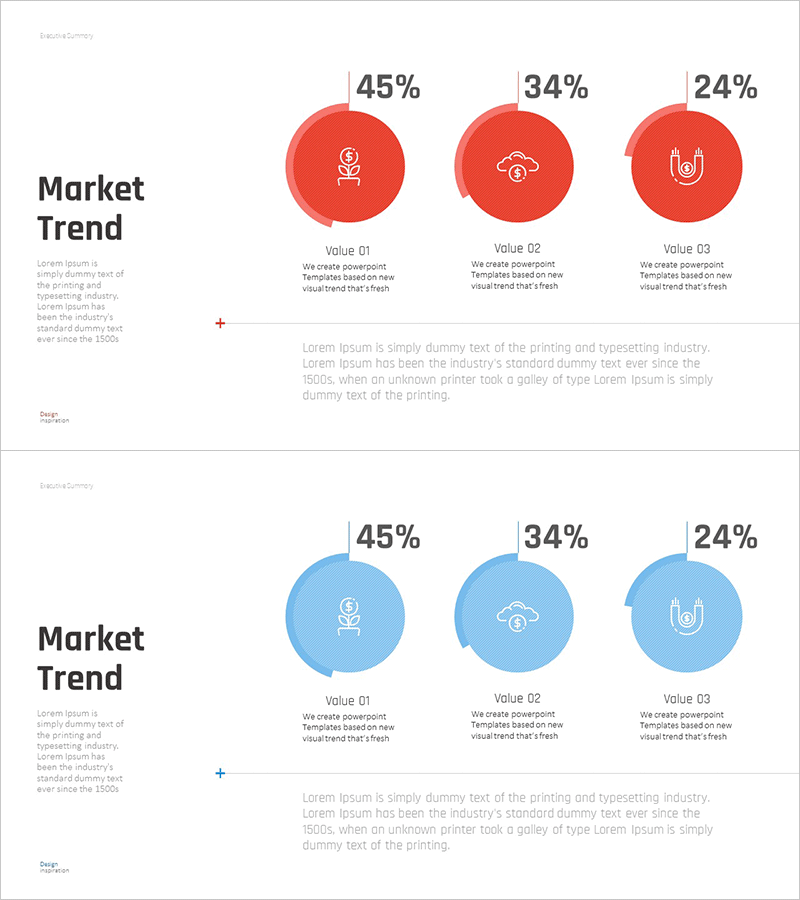
Market Trend Change Analysis Graph – Key Insights Visualization
#Product/Service #Market and Competitor Analysis #Graph
-
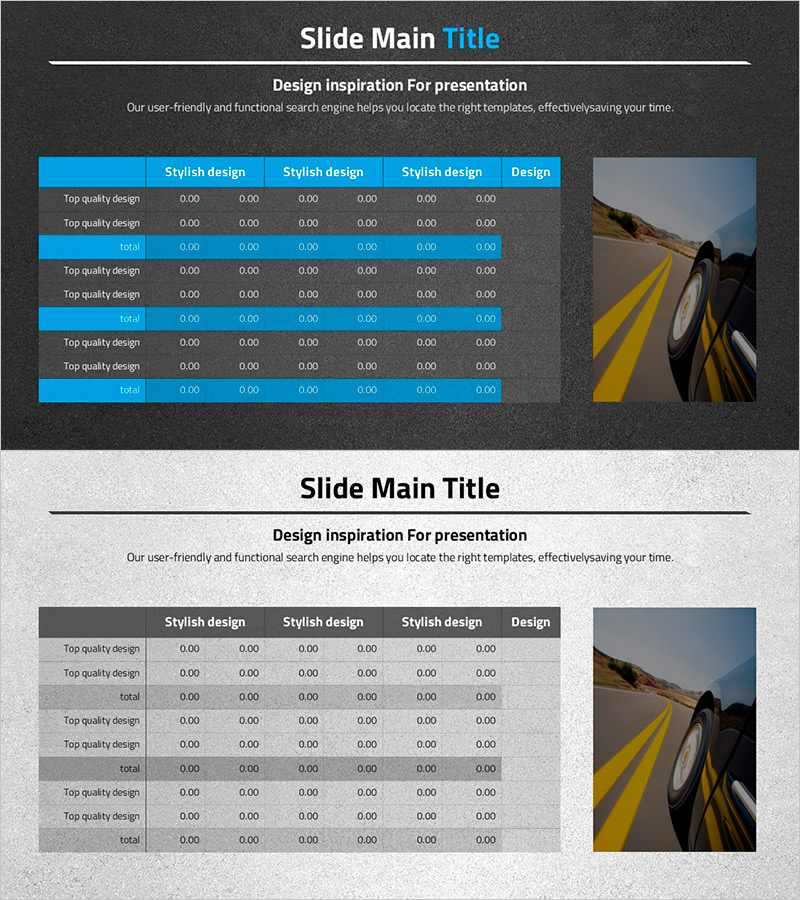
Car Wide Template Table – Visualizing Financial Performance
#Financial Plans and Performance #Diagram #Sales and Revenue
