Company Introduction
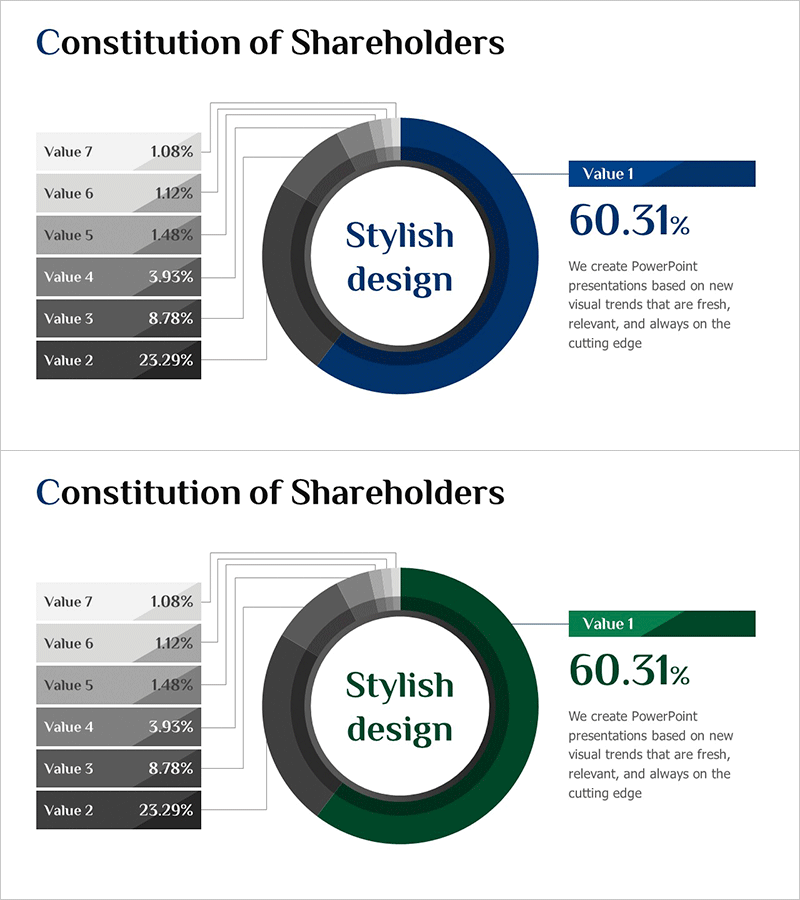
Chart of Changes in the Ratio of Institutional and Individual Investors – Simplified Shareholder Composition
RM0600006_6
- Last Update 12/21/2025
- File Size 1MB
- # of Slides 2
- File Format PPTX
- Slide Ratio 16:9
- Color
Keywords
About the Product
This slide visually presents the changes in the ratio of institutional and individual investors using a donut chart, making it easy to understand the shareholder composition. The harmonious combination of navy blue and green conveys stability and professionalism, and the organized data area aids presenters in delivering clear information. Perfect for investment analysis reports and market trend presentations, this slide embodies the emotional message of 'concise visualization'. Text and data structures are easy to edit, with an editing difficulty rated as 'easy', allowing for seamless incorporation into various presentation materials.
Related Products
-

Target Market Status and Current Projects – Market Analysis Diagram
#Market and Competitor Analysis #Marketing Plan and Strategy #Diagram
-

Comparison of Fruit Consumption – Market Trend Analysis
#Market and Competitor Analysis #Financial Plans and Performance #Graph
-
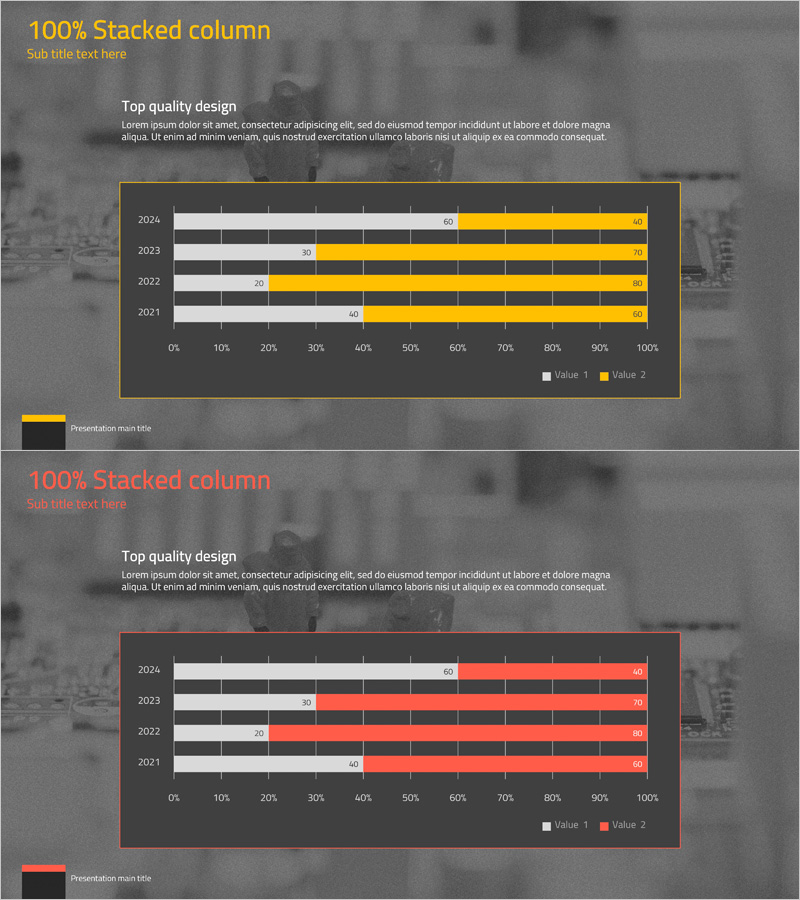
Technology Service Market Trends and Status – 100% Stacked Bar Chart
#Market and Competitor Analysis #Graph #Market Status
-
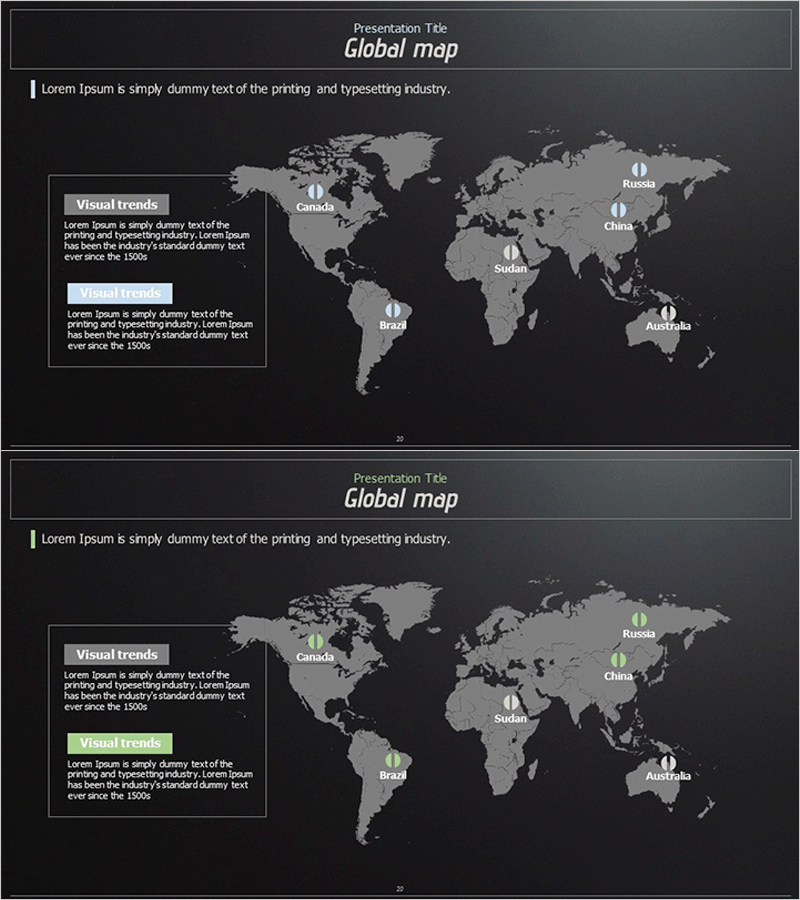
Global Target Market Analysis Map – Effective Overseas Expansion Strategy
#Company Introduction #Market and Competitor Analysis #Other
