Target Market Status and Current Projects – Market Analysis Diagram
RJ0700016_19
- Last Update 07/26/2025
- File Size 0.5MB
- # of Slides 2
- File Format PPTX
- Slide Ratio 16:9
- Color
Keywords
- #Content-Based Slides
- #Design-Based Slides
- #Market and Competitor Analysis
- #Marketing Plan and Strategy
- #Diagram
- #Other
- #Target Market
- #Target Market Strategy
- #Cluster
- #Closed Cluster Diagram
- #16:9
- #closed-form pie chart diagram PowerPoint
- #market analysis slide template
- #regional percentage chart
- #world map pie graph
- #global market presentation slide
About the Product
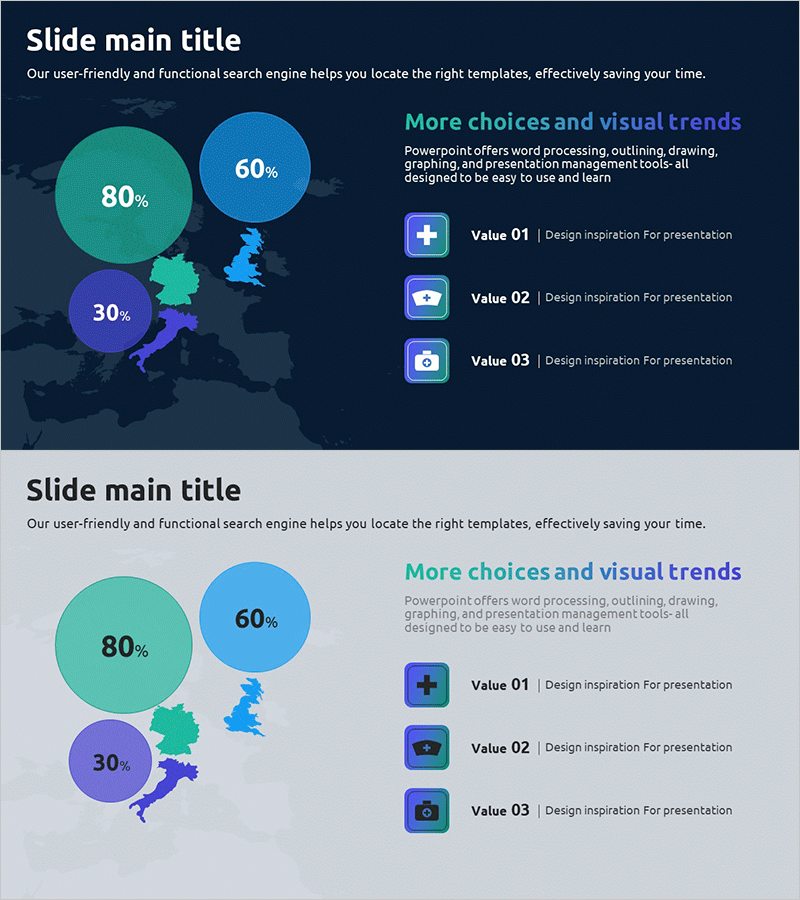
A PowerPoint slide that visualizes regional market status using three pie charts overlaid on a world map background. The teal, blue, and purple circular charts represent percentage data (80%, 60%, 30%) for different geographic regions, creating an intuitive global market analysis presentation. Two slide layouts are included—one with a dark navy background and one with a light gray background—allowing you to choose the version that best fits your presentation environment. Ideal for marketing strategy presentations, business status reports, investor pitch decks, and global market expansion discussions.
Usage Points
-
Main Usage
Effectively communicate regional market share and geographic distribution of business data using three pie charts positioned on a world map. The visual hierarchy clearly shows comparative analysis across regions, making complex market data accessible at a glance.
-
How to Use
Insert this slide in the market analysis section of business plans, investor pitch decks, or marketing strategy presentations. Customize the percentage values and region labels to match your actual data. The color-coded circles help audiences quickly identify regional importance and market concentration.
-
Recommended For
Marketing managers, business development teams, investor relations professionals, and executives presenting global market expansion strategies. Perfect for companies entering new markets, multinational corporations reporting regional performance, and organizations analyzing geographic market penetration.
-
Slide Structure
Two-slide set featuring dark navy and light gray background versions. Each slide displays a world map on the left with three overlapping pie charts (representing 80%, 60%, 30% data), accompanied by text areas and three icon elements on the right for balanced information hierarchy.
Related Products
-

Target Market VR Service Strategy
#Market and Competitor Analysis #Marketing Plan and Strategy #Diagram
-

Progress of the European Space Industry by Region Diagram
#Market and Competitor Analysis #Marketing Plan and Strategy #Diagram
-

Asia Map Target Region Strategy
#Market and Competitor Analysis #Marketing Plan and Strategy #Diagram
-

Export Strategy to Target Asian Countries
#Market and Competitor Analysis #Marketing Plan and Strategy #Diagram
