Business Introduction
Core Business & Operating Model Diagram – Visualization of Business Structure
RM0600005_10
- Last Update 12/21/2025
- File Size 0.3MB
- # of Slides 2
- File Format PPTX
- Slide Ratio 16:9
- Color
Keywords
About the Product
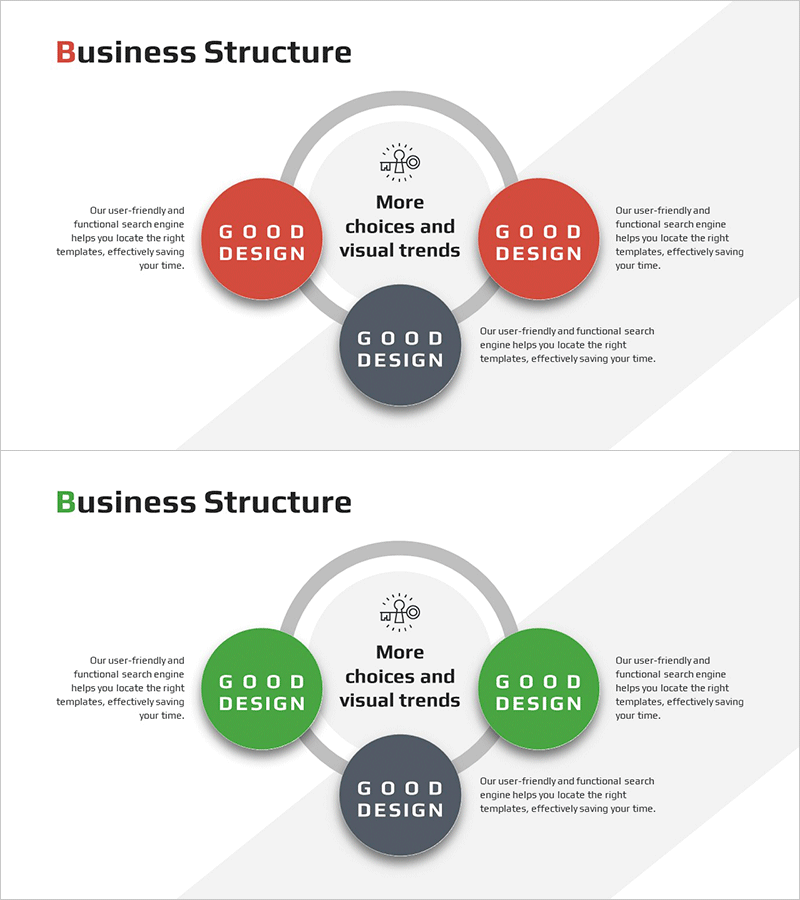
This slide presents the 'Core Business & Operating Model Diagram', intuitively illustrating the business structure. Featuring a cluster format connecting various elements, it is ideal for visualizing actual business processes or strategies. The harmonious blend of red and green creates a striking yet trustworthy visual. This slide is suitable for internal reports, business proposals, or strategic meetings, designed for easy understanding by practitioners and executives. Text and graphic elements are easily editable, with an editing difficulty rating of 'easy'.
Related Products
-
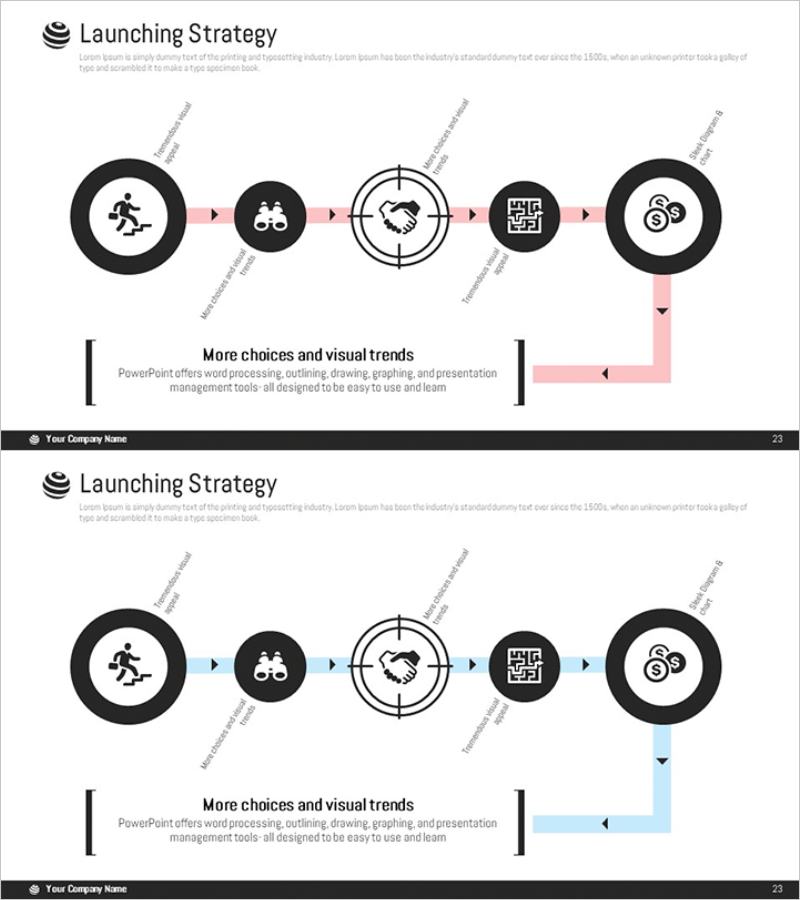
Diagram of the Steps in Developing a Launch Strategy
#Business Vision and Strategy #Marketing Plan and Strategy #Diagram
-
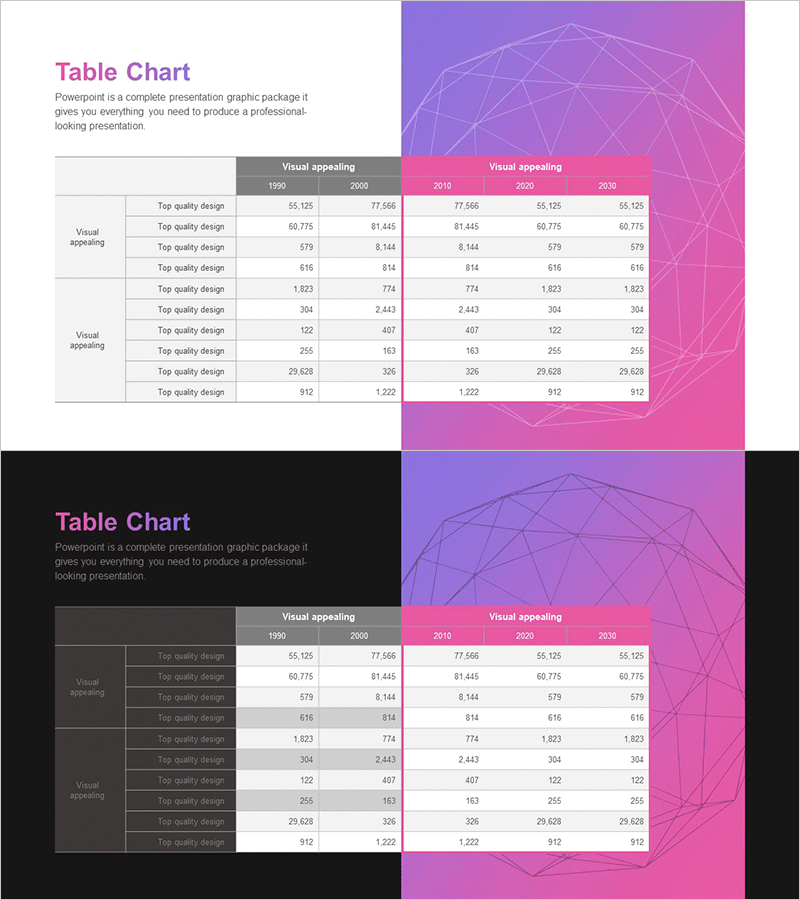
Visualizing Profit & Loss with Reverse Table Chart
#Financial Plans and Performance #Diagram #Income Statement
-

Cybersecurity Business Area Diagram – Safe Directions
#Company Introduction #Business Introduction #Diagram
-
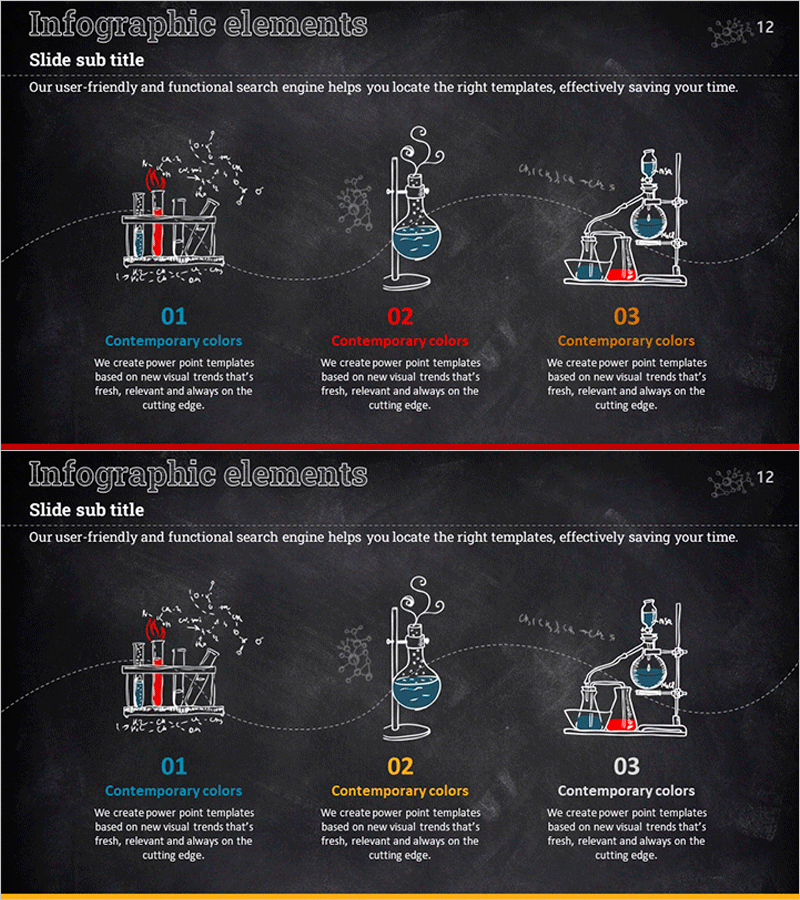
Science Experiment Process Description Slides – An Understandable Diagram
#Product/Service #Business Promotion Strategy #Diagram
