Science Experiment Process Description Slides – An Understandable Diagram
RJ0400025_11
- Last Update 05/24/2025
- File Size 4MB
- # of Slides 2
- File Format PPTX
- Slide Ratio 16:9
- Color
Keywords
- #Content-Based Slides
- #Design-Based Slides
- #Product/Service Introduction
- #Business Strategy
- #Diagram
- #Program Introduction
- #Step-by-Step Schedule Plan
- #Cluster
- #Closed Cluster Diagram
- #16:9
- #science experiment diagram PowerPoint
- #process explanation slide template
- #cluster diagram PPT
- #laboratory procedure presentation
- #3-step process slide download
About the Product
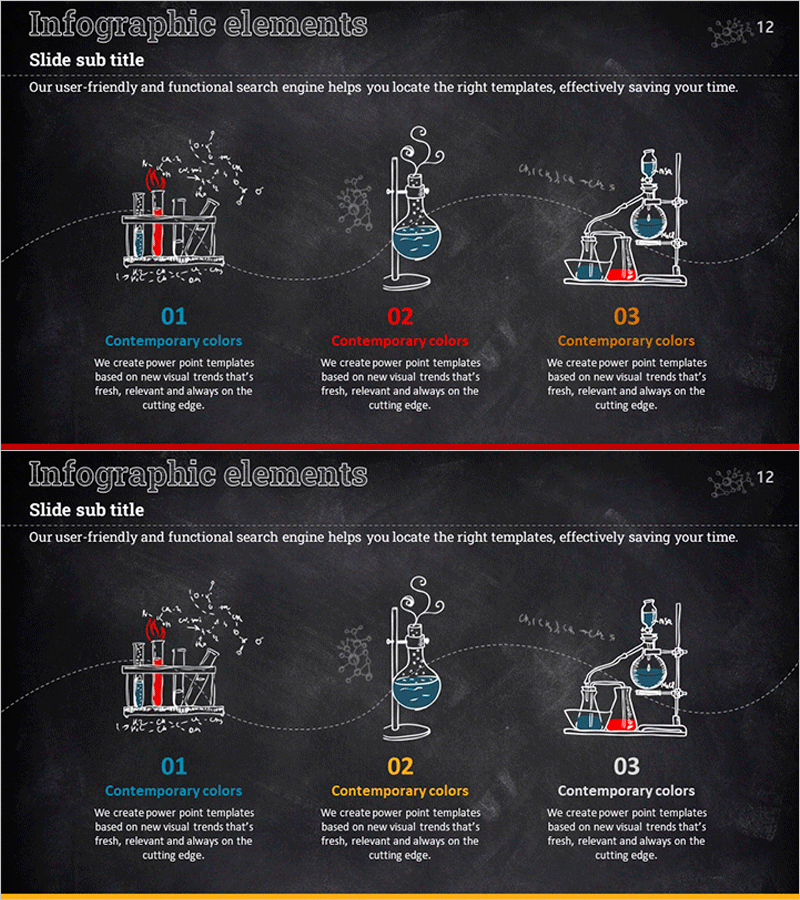
A cluster diagram PowerPoint slide that visually explains the step-by-step process of scientific experiments. Against a black chalkboard background, three white line-drawn laboratory equipment icons are connected by dotted lines, with blue, red, and orange accent points placed at each stage. The 2-slide set provides identical layouts for multiple process explanations. This presentation slide effectively communicates complex experimental procedures in a simple and easy-to-understand manner for science, technology, and research development presentations.
Usage Points
-
Main Usage
A slide designed to visually explain experimental procedures, process flows, and step-by-step progression in science, technology, and research development fields. The cluster diagram structure simultaneously expresses the independence and connectivity of each stage, making complex experimental processes easy to understand.
-
How to Use
Use this slide in the methodology or technical section of your presentation to explain experimental procedures. Edit each node with stage names, descriptions, and results to create a customized process diagram. Color accents can emphasize important stages or indicate sequence.
-
Recommended For
Recommended for scientists, researchers, technical professionals, educators, and students presenting experimental design, research methodology, and technical processes. Suitable for university seminars, academic presentations, technical reports, research proposals, and science education materials.
-
Slide Structure
2-slide set. Each slide features a black chalkboard background with 3 laboratory equipment icons connected by dotted lines in a cluster diagram. Equipment is arranged left to right: laboratory apparatus, flask, and analysis equipment. Blue, red, and orange text labels are positioned below each node.
Related Products
-

Space Industry Schedule Diagram – Introduction to Business Development Strategy
#Product/Service Introduction #Business Strategy #Diagram
-

Yoga Diet Program Order – Innovative Approach
#Product/Service Introduction #Business Strategy #Diagram
-

Introducing the Card Company Service Program – Effective Business Strategy
#Product/Service Introduction #Business Strategy #Diagram
-

Overview of the Lesson Management Program – Effective Stage Management Diagram
#Product/Service Introduction #Business Strategy #Diagram
