Technology Sector
Consumer Response Analysis and Improvement Strategies – Insight Driven by Data
RM0400009_24
- Last Update 12/21/2025
- File Size 1.1MB
- # of Slides 2
- File Format PPTX
- Slide Ratio 16:9
- Color
Keywords
About the Product
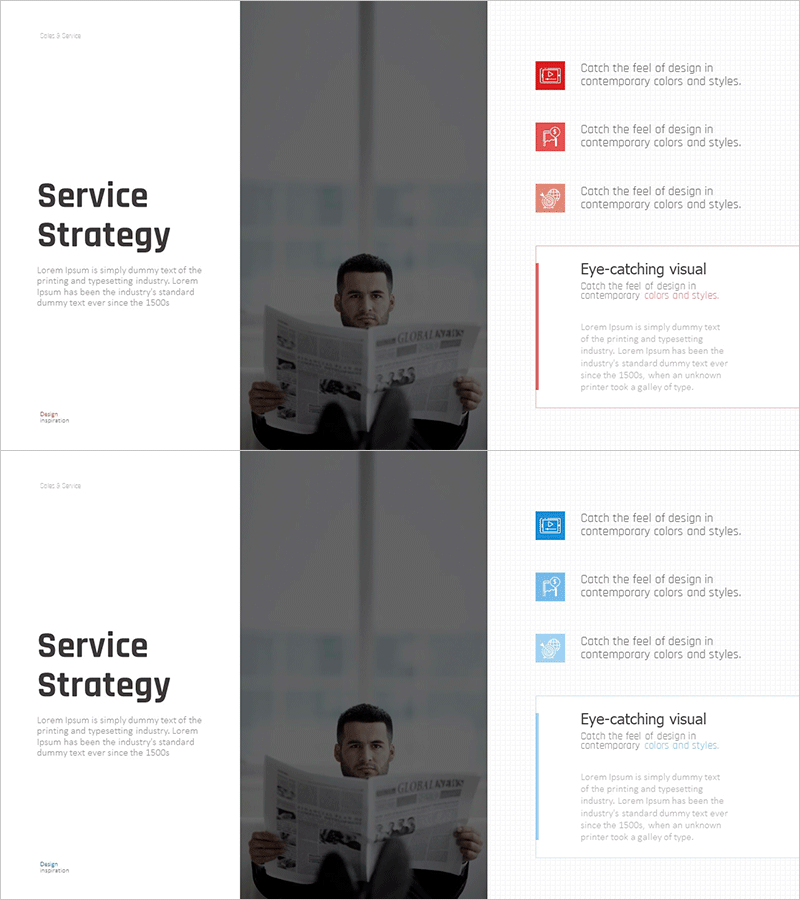
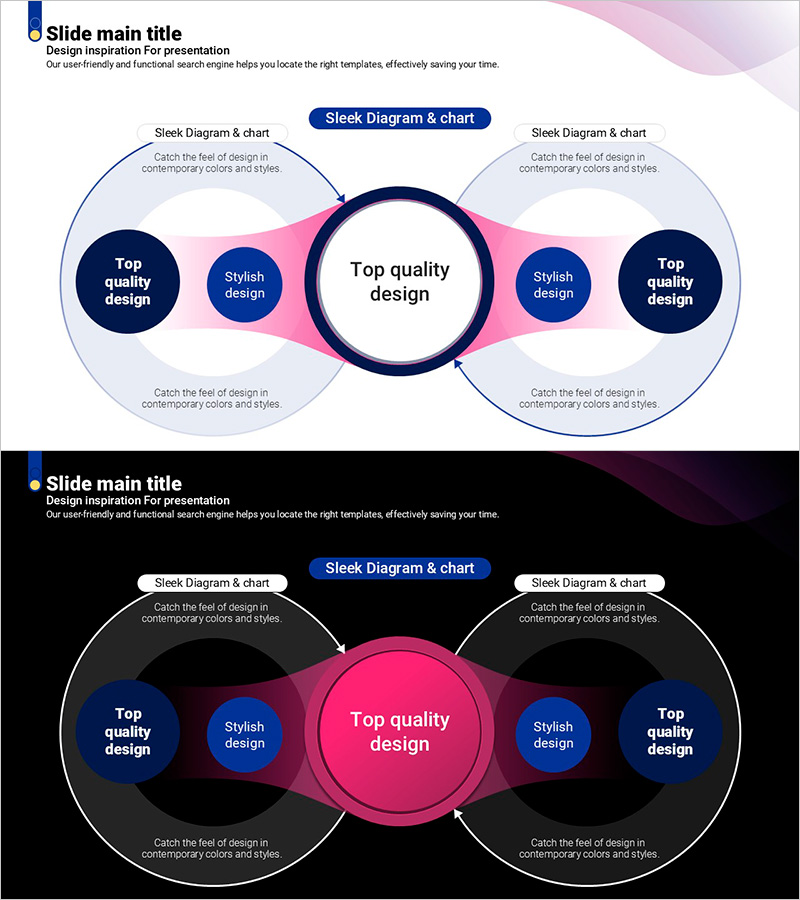
This slide covers consumer response analysis and improvement strategies, presented in a cluster diagram format for visual representation of consumer data. It is suitable for branding marketing plans or service strategies, utilizing a harmonious blend of red and blue to enhance visual impact and stability. This slide can be used in various presentations and reports in marketing and technical sectors, designed for easy editing.
Related Products
-
Transportation Services Competitive Advantage Comparison Graph
#Product/Service #Market and Competitor Analysis #Diagram
-
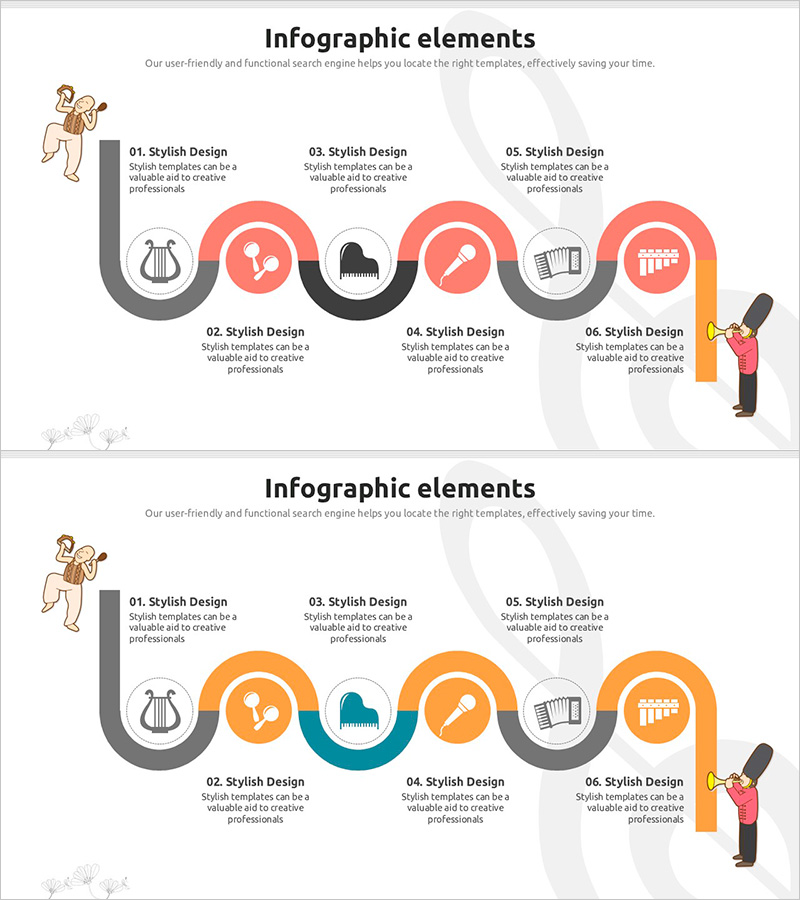
Music Program Flow System Slide Template – Business Execution Strategy
#Business Promotion Strategy #Diagram #Roadmap
-
Curved Theme Purple Template Diagram
#Business Promotion Strategy #Marketing Plan and Strategy #Diagram
-
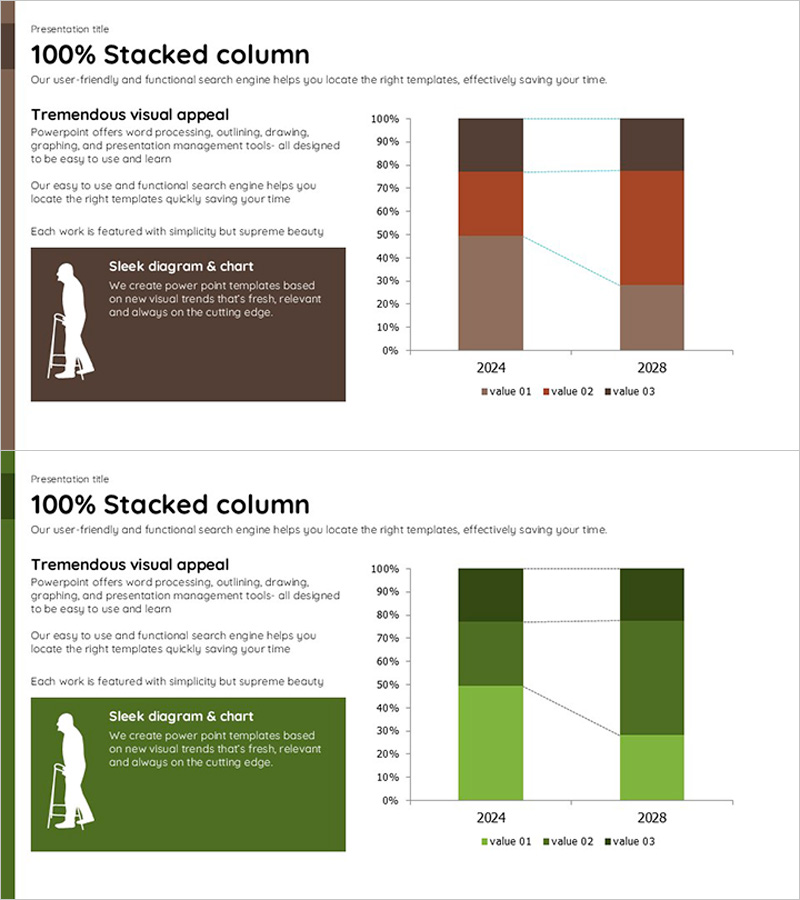
Visualizing the Changing Trend of the Ageing Population with a 100% Stacked Bar Graph
#Business Promotion Strategy #Market and Competitor Analysis #Marketing Plan and Strategy
